
|
|  | - ISM Services slows, but employment gauge returns to expansion.
- Fed hike bets cool after weaker payrolls and revisions.
- FOMC minutes, jobless claims and CPI guide next move.
Gold (XAU/USD) price retreats by some 0.50% on Monday as the Greenback remains steady despite traders repricing a less hawkish Federal Reserve (Fed) following last Thursday’s softer-than-expected jobs report. The XAU/USD pair trades at $4,153, down 0.50%. XAU/USD retreats as steady Dollar and yields cap recoveryData from the US showed that business activity in the services sector was modestly softer than expected, with the ISM Services PMI dipping from 54.5 to 54. Even though the data indicated a slowdown, the Employment Index improved, while a measure of producer prices slowed from 71.3 to 67.7. Monday’s data outweighed June’s Nonfarm Payrolls report, which fell short of expectations, and the April and May data, revised lower, an indication of further deterioration. Traders? trimmed Fed hawkish bets. As of writing, they are expecting an 88% chance of a rate hike at the December meeting, as they priced in 22 basis points of tightening. For the July meeting, money markets expect the Fed to hold rates unchanged, with odds at 77%, according to Prime Terminal data. 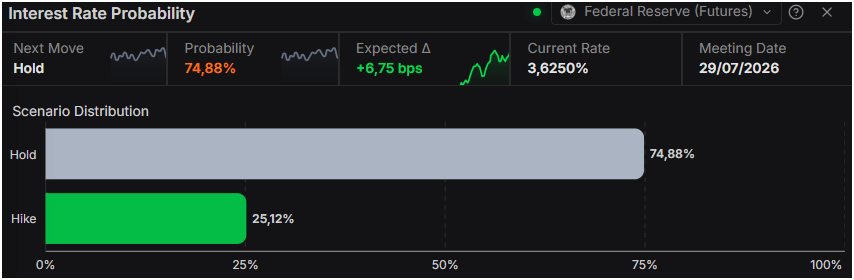 Source: Prime Terminal Source: Prime TerminalBullion weighed by high US yields, strong US DollarIn the meantime, the US Dollar Index (DXY), which tracks the buck’s value against six currencies, is up 0.03% at 100.90, a headwind for the non-yielding metal. Also, US Treasury yields are steady, with the 10-year benchmark note yielding 4.451%, unchanged. Geopolitics had fallen to the background as the second round of talks between the US and Iran in Islamabad was set to start next Saturday. Remaining issues include Iran’s nuclear program, frozen assets, the Strait of Hormuz, and Lebanon. Aside from this, the US economic docket will feature the Fed’s last meeting minutes, followed by Initial Jobless Claims for the week ending July 4, as traders brace for July 14 Consumer Price Index (CPI) figures. XAU/USD technical outlook: Gold stays bearish, fails to clear $4,200Gold price downtrend is intact as long as XAU fails to clear a downtrend-resistance trendline at around $4,200-$4,225. Additionally, a 'death-cross' has formed on the daily chart, suggesting sellers have overtaken buyers and opening the door to further losses. The Relative Strength Index (RSI) is bearish, despite aiming towards its 50-neutral level. However, during the last two trading sessions, it opened the door for further downside. If XAU/USD drops below $4,200, the next support would be the psychological $4,100, before testing $4,000 and the year-to-date (YTD) low at $3,941. For a bullish reversal, Gold needs to decisively clear $4,250 before testing $4,300. Overhead lies the 50-day Simple Moving Average (SMA) at $4,391, followed by the 200-day SMA at $4,488, ahead of $4,500. 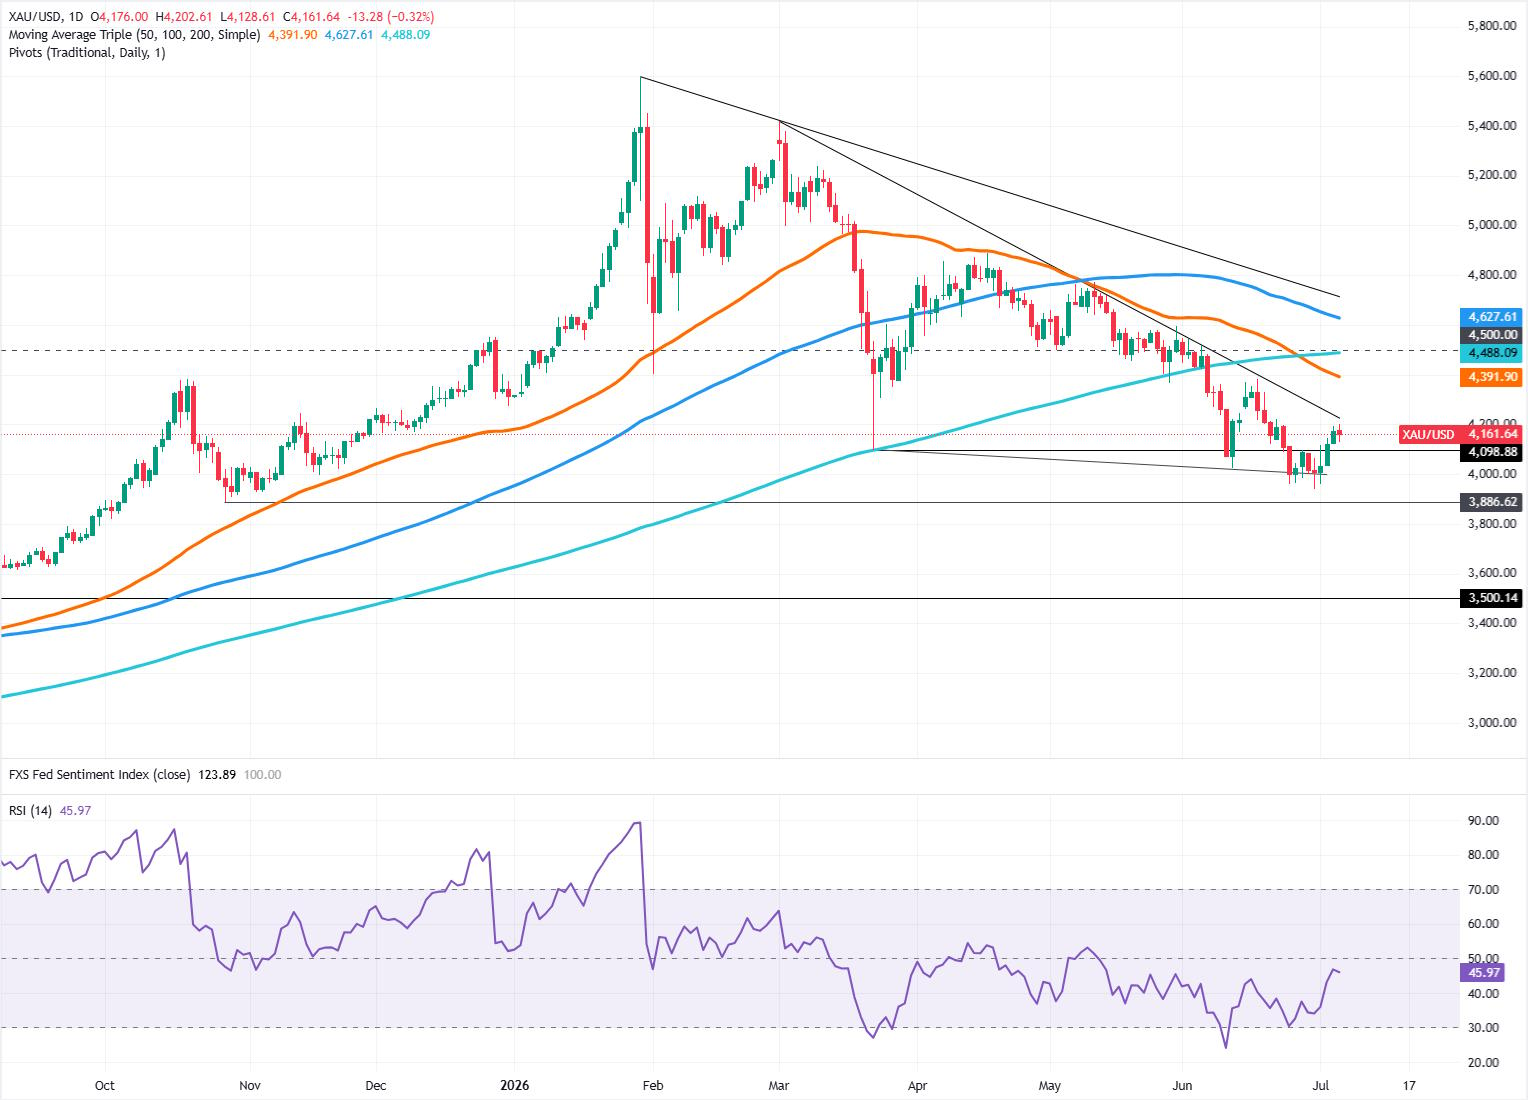 Gold daily chart Gold daily chart
Gold FAQs
Gold has played a key role in human’s history as it has been widely used as a store of value and medium of exchange. Currently, apart from its shine and usage for jewelry, the precious metal is widely seen as a safe-haven asset, meaning that it is considered a good investment during turbulent times. Gold is also widely seen as a hedge against inflation and against depreciating currencies as it doesn’t rely on any specific issuer or government.
Central banks are the biggest Gold holders. In their aim to support their currencies in turbulent times, central banks tend to diversify their reserves and buy Gold to improve the perceived strength of the economy and the currency. High Gold reserves can be a source of trust for a country’s solvency. Central banks added 1,136 tonnes of Gold worth around $70 billion to their reserves in 2022, according to data from the World Gold Council. This is the highest yearly purchase since records began. Central banks from emerging economies such as China, India and Turkey are quickly increasing their Gold reserves.
Gold has an inverse correlation with the US Dollar and US Treasuries, which are both major reserve and safe-haven assets. When the Dollar depreciates, Gold tends to rise, enabling investors and central banks to diversify their assets in turbulent times. Gold is also inversely correlated with risk assets. A rally in the stock market tends to weaken Gold price, while sell-offs in riskier markets tend to favor the precious metal.
The price can move due to a wide range of factors. Geopolitical instability or fears of a deep recession can quickly make Gold price escalate due to its safe-haven status. As a yield-less asset, Gold tends to rise with lower interest rates, while higher cost of money usually weighs down on the yellow metal. Still, most moves depend on how the US Dollar (USD) behaves as the asset is priced in dollars (XAU/USD). A strong Dollar tends to keep the price of Gold controlled, whereas a weaker Dollar is likely to push Gold prices up.
|
|
|
| | Jul 6 2026 6:43PM EST |
|
|
| | - US Dollar trims intraday gains as traders reassess the Fed's monetary policy outlook.
- Weaker-than-expected US jobs data and easing Oil prices temper expectations of a near-term Fed rate hike.
- Traders look to FOMC minutes for fresh guidance on interest rates.
The US Dollar Index (DXY) trims its gains on Monday after opening the week on a firmer note, as traders await greater clarity on the Federal Reserve's (Fed) interest rate path before placing fresh directional bets. At the time of writing, the index, which tracks the US Dollar against a basket of six major currencies, is trading around 100.92 after easing from an intraday high of 101.14. The Fed is unlikely to raise interest rates anytime soon after Thursday's weaker-than-expected US Nonfarm Payrolls (NFP) report. At the same time, Oil prices have fully unwound their US-Iran war-driven rally as shipping through the Strait of Hormuz continues to improve following last month's interim peace agreement between the United States and Iran. Lower Oil prices have eased inflation risks, suggesting the Fed may not need to tighten monetary policy as aggressively as markets had previously feared. Even so, with inflation still running above the Fed's 2% target, policymakers remain committed to bringing inflation back to target, suggesting monetary policy is likely to remain restrictive for the time being. According to the CME FedWatch Tool, traders are pricing in a 77% probability that the Fed will keep interest rates unchanged at this month's meeting, while the probability of a rate hike at the September meeting has fallen to 56% from 63% before the US jobs report was released. Meanwhile, the United States and Iran have yet to reach a final agreement. Key sticking points include the future management of the Strait of Hormuz, the release of frozen Iranian assets, sanctions relief, and Tehran's commitments regarding its nuclear program. With geopolitical risks lingering and traders still pricing in at least one Fed rate hike this year, further downside in the US Dollar is likely to remain limited. On the data front, the ISM Services Purchasing Managers Index (PMI) came in at 54.0 in June, in line with market expectations. Although the reading eased from 54.5 in May, it marked the 23rd consecutive month of expansion. The US economic calendar is relatively light this week, with the ADP Employment Change report due on Tuesday and weekly Initial Jobless Claims on Thursday. Investors will also closely watch the Federal Open Market Committee (FOMC) meeting minutes on Wednesday for fresh clues on the Fed's monetary policy outlook.
Fed FAQs
Monetary policy in the US is shaped by the Federal Reserve (Fed). The Fed has two mandates: to achieve price stability and foster full employment. Its primary tool to achieve these goals is by adjusting interest rates.
When prices are rising too quickly and inflation is above the Fed’s 2% target, it raises interest rates, increasing borrowing costs throughout the economy. This results in a stronger US Dollar (USD) as it makes the US a more attractive place for international investors to park their money.
When inflation falls below 2% or the Unemployment Rate is too high, the Fed may lower interest rates to encourage borrowing, which weighs on the Greenback.
The Federal Reserve (Fed) holds eight policy meetings a year, where the Federal Open Market Committee (FOMC) assesses economic conditions and makes monetary policy decisions.
The FOMC is attended by twelve Fed officials – the seven members of the Board of Governors, the president of the Federal Reserve Bank of New York, and four of the remaining eleven regional Reserve Bank presidents, who serve one-year terms on a rotating basis.
In extreme situations, the Federal Reserve may resort to a policy named Quantitative Easing (QE). QE is the process by which the Fed substantially increases the flow of credit in a stuck financial system.
It is a non-standard policy measure used during crises or when inflation is extremely low. It was the Fed’s weapon of choice during the Great Financial Crisis in 2008. It involves the Fed printing more Dollars and using them to buy high grade bonds from financial institutions. QE usually weakens the US Dollar.
Quantitative tightening (QT) is the reverse process of QE, whereby the Federal Reserve stops buying bonds from financial institutions and does not reinvest the principal from the bonds it holds maturing, to purchase new bonds. It is usually positive for the value of the US Dollar.
|
|
|
| | Jul 6 2026 6:12PM EST |
|
|
| | - WTI has round-tripped the entire war premium and now sits just above its February base.
- OPEC+ lifted quotas again for August while actual Gulf output is still catching up.
- The Brent curve's slip into contango frames Wednesday's EIA inventory data as the week's main test.
West Texas Intermediate (WTI) has spent three weeks handing back what the war spent three months building, and the tape now reads as though February never ended. The US benchmark drifts near $68.50 while Brent hovers close to $72.00, both a couple of dollars above their pre-war bases and nearly 40% below the March extremes. The candles have been shrinking for a week and the ranges with them, which tells you the momentum did not fade so much as leave with the risk premium. The June 17 interim agreement between Washington and Tehran reopened the Strait of Hormuz to normal traffic, the fear trade was carried out of the building, and what remains is a market forced to price ordinary supply and demand for the first time this year. It does not appear thrilled by the exercise. The differential says the war trade is closedBrent's premium over WTI has settled near $3.50, which is plain freight-and-quality territory rather than anything resembling a risk premium. Seaborne barrels carried the fear through the war, and that gap has now compressed back to the boring arithmetic of pipelines versus tankers. Nobody is paying extra for Brent's postcode anymore, and the differential is the cleanest single gauge that the geopolitical bid has been fully extracted. Everyone is selling into the reunionThe Organization of the Petroleum Exporting Countries (OPEC) and its allies, collectively OPEC+, agreed on Sunday to add another 188K barrels per day (bpd) to August quotas, the latest step in restoring 940K bpd of paper supply since the war began. Actual output still lags the paperwork, with the biggest Gulf producers having lost around 6 million bpd at the worst of the closure, though flows have been recovering since the June agreement. The United Arab Emirates has meanwhile walked away from the quota system altogether, Washington is still working through a 172 million barrel release from the Strategic Petroleum Reserve (SPR) agreed during the war, and US production set a record near 14 million bpd in May. The curve said the quiet partThe Brent futures curve tipped into contango last week for the first time this year, with the six-month spread near minus 56 cents; when the market pays you to store barrels, it is telling you it has too many of them. OPEC's own monthly report has trimmed 2026 demand growth in back-to-back months, to under 1 million bpd, so the supply wave is arriving into a shrinking demand forecast. Strategists have begun sketching Brent into the 60s by year-end, and for once the futures market is not arguing with them. Wednesday brings the receiptsWeekly inventory data from the Energy Information Administration (EIA) lands Wednesday at 14:30 GMT, the first clean read on stockpiles since Hormuz traffic began normalizing, after industry figures Tuesday evening. Minutes from the June Federal Open Market Committee (FOMC) meeting arrive the same day at 18:00 GMT; a hawkish Federal Reserve (Fed) keeps the Dollar bid, and Dollar-priced barrels do not enjoy that. OPEC+ ministers reconvene on August 2, where a compensation-hungry Iraq is already agitating for a bigger quota. Levels to watchResistance: WTI's first hurdle is the $70.00 handle, with the June breakdown shelf near $72.00 behind it; Brent faces the same test at $74.00. Reclaiming those levels on a daily close is the minimum before anyone argues the flush is finished. Support: Initial demand sits close to $67.50 for WTI and around $71.00 for Brent, the floors of the past week's drift. Below there, $65.00 is the only round figure of note before the February bases near $62.00 for WTI and $66.50 for Brent, where this entire journey started. Bias: Bearish. The Stochastic Relative Strength Index (Stoch RSI) has been pinned near its floor for two weeks while price keeps leaking, and oversold in a downtrend is a description, not a buy signal. With quotas rising, the reserve draining, and the curve paying for storage, rallies toward $70.00 are for selling; only a daily close back above $72.00 changes the conversation, while a break of $67.50 puts the February base on the table.
WTI daily chart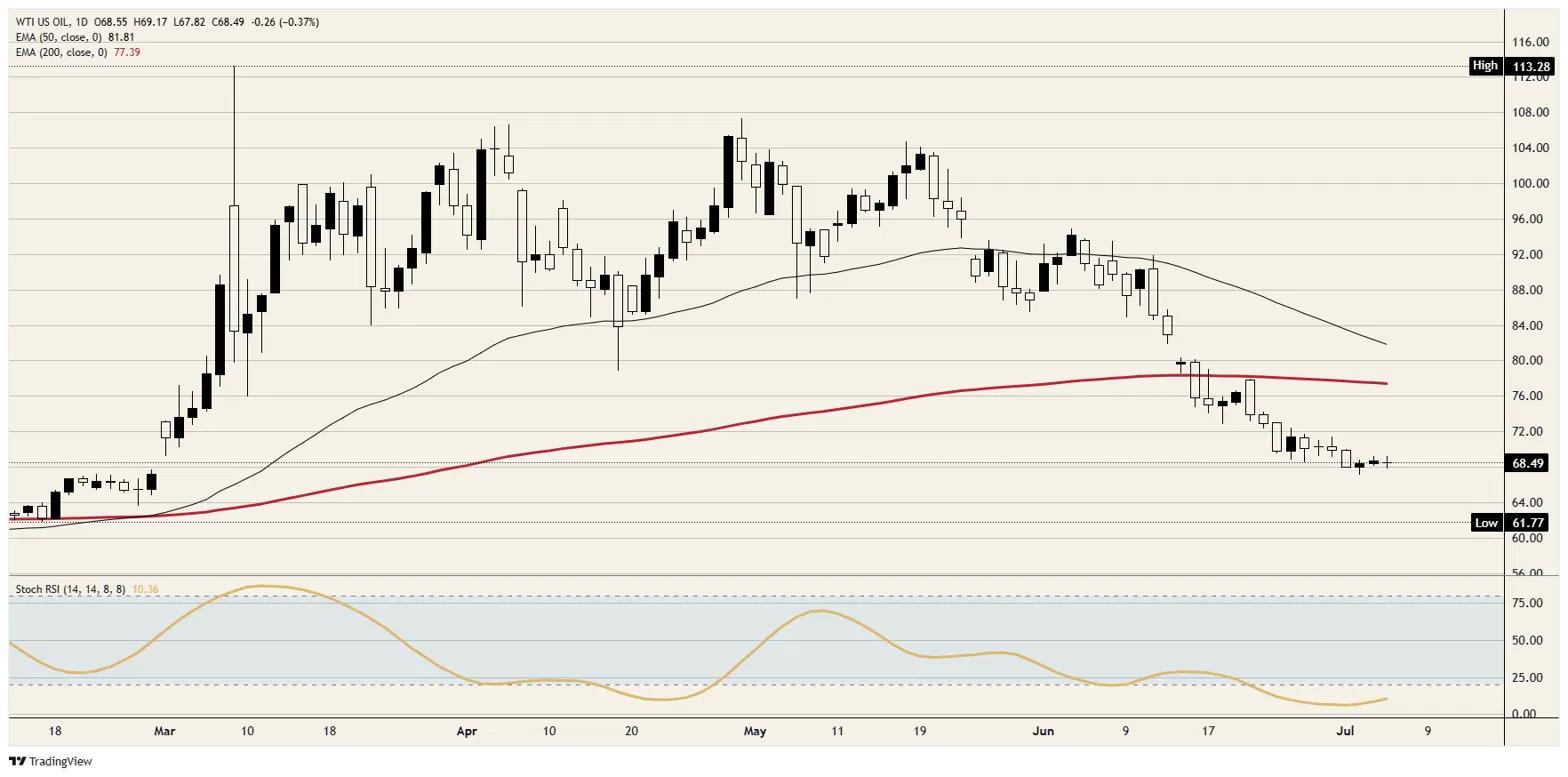 Brent daily chart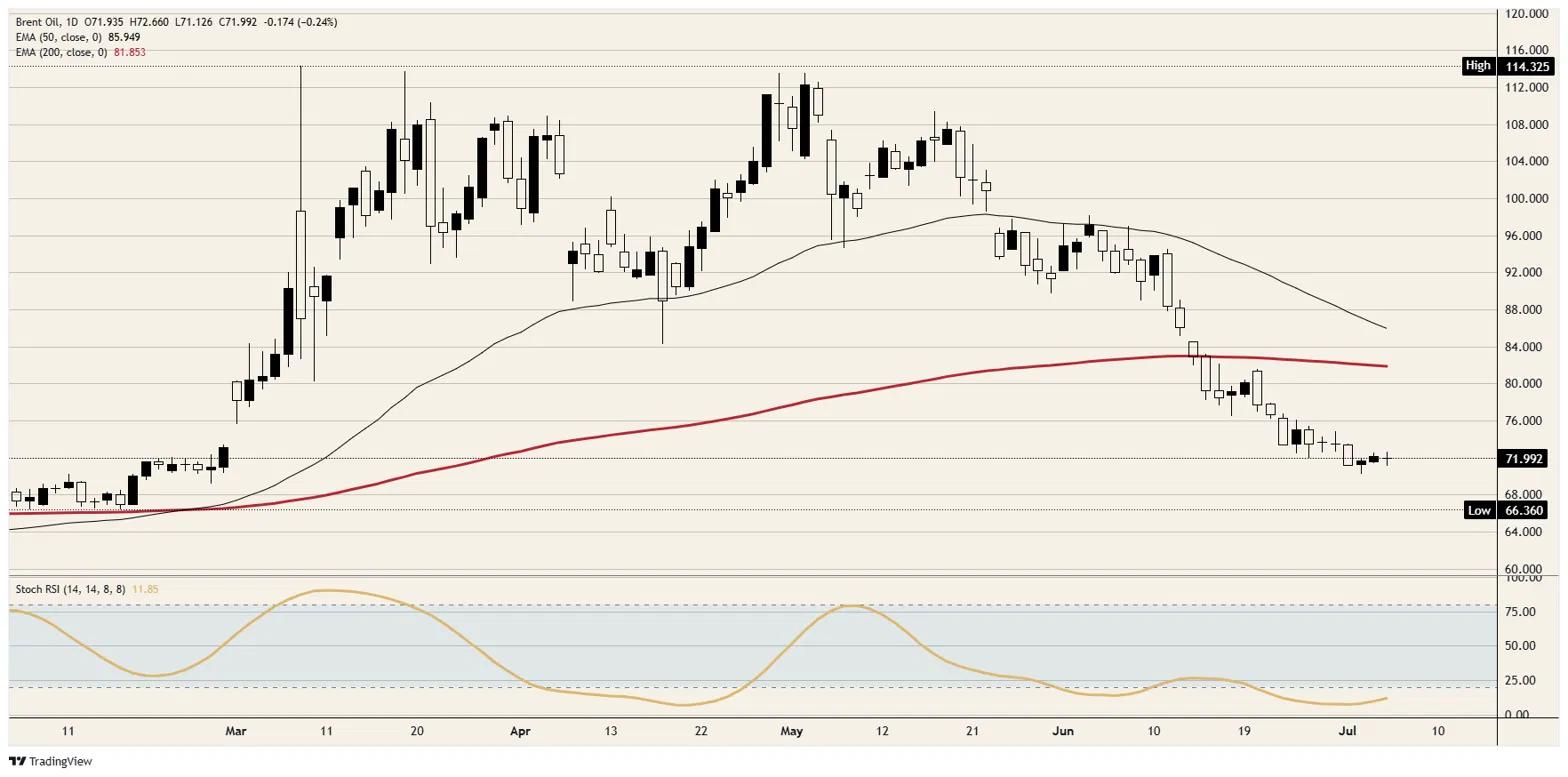
WTI Oil FAQs
WTI Oil is a type of Crude Oil sold on international markets. The WTI stands for West Texas Intermediate, one of three major types including Brent and Dubai Crude. WTI is also referred to as “light” and “sweet” because of its relatively low gravity and sulfur content respectively. It is considered a high quality Oil that is easily refined. It is sourced in the United States and distributed via the Cushing hub, which is considered “The Pipeline Crossroads of the World”. It is a benchmark for the Oil market and WTI price is frequently quoted in the media.
Like all assets, supply and demand are the key drivers of WTI Oil price. As such, global growth can be a driver of increased demand and vice versa for weak global growth. Political instability, wars, and sanctions can disrupt supply and impact prices. The decisions of OPEC, a group of major Oil-producing countries, is another key driver of price. The value of the US Dollar influences the price of WTI Crude Oil, since Oil is predominantly traded in US Dollars, thus a weaker US Dollar can make Oil more affordable and vice versa.
The weekly Oil inventory reports published by the American Petroleum Institute (API) and the Energy Information Agency (EIA) impact the price of WTI Oil. Changes in inventories reflect fluctuating supply and demand. If the data shows a drop in inventories it can indicate increased demand, pushing up Oil price. Higher inventories can reflect increased supply, pushing down prices. API’s report is published every Tuesday and EIA’s the day after. Their results are usually similar, falling within 1% of each other 75% of the time. The EIA data is considered more reliable, since it is a government agency.
OPEC (Organization of the Petroleum Exporting Countries) is a group of 12 Oil-producing nations who collectively decide production quotas for member countries at twice-yearly meetings. Their decisions often impact WTI Oil prices. When OPEC decides to lower quotas, it can tighten supply, pushing up Oil prices. When OPEC increases production, it has the opposite effect. OPEC+ refers to an expanded group that includes ten extra non-OPEC members, the most notable of which is Russia.
|
|
|
| | Jul 6 2026 6:08PM EST |
|
|
| | Rabobank’s FX Strategy team discusses the New Zealand Dollar (NZD) ahead of the July 8 Reserve Bank of New Zealand (RBNZ) meeting, where consensus and the bank expect a 25 bp hike to 2.5%. They note mixed views from the NZ (New Zealand) shadow board, moderating inflation as Oil falls, and a fragile domestic recovery. With nearly four hikes priced, Rabobank sees limited NZD upside and expects choppy NZD/USD ranges. RBNZ path, inflation and NZD pricing"In line with Rabobank’s view, the consensus of the Bloomberg survey points to a 25 bp rate hike, which would take the main policy rate to 2.5%. Forecasters, however, are not unanimous." "This news has clearly fanned some doubts in the market about the resolve to the RBNZ to tighten policy and has consequently weighed on the NZD. Today the NZD is positioned second to last on the G10 one day performance table, just above the JPY." "In view of the inflationary impact of this year’s closure of the Strait of Hormuz, RBNZ Governor Breman stated after the last RBNZ policy meeting in May that the central bank expects to “increase interest rates this year, to help keep a lid on inflation”. That said, oil prices have come down substantially in the wake of the June 17 signing of the MoU by the US and Iran to levels last seen just before the start of the war." "Currently, market implied interest rates suggest scope for almost four 25 bps rate hikes from the RBNZ over the next year to around 3.18%, from 2.25% currently. This is not so dissimilar to the forecasts from the NZ shadow Board, whose views are centred around rates reaching 3-3.25% over the next year." "With so much tightening already in the price, we don’t see much scope for the NZD to improve its position on the G10 performance table this year. Indeed, any sign that the RBNZ is backing down on its hawkish tone, could leave the NZD vulnerable." (This article was created with the help of an Artificial Intelligence tool and reviewed by an editor. Know more.) |
|
|
| | Jul 6 2026 5:57PM EST |
|
|
| | - DJIA set a fresh record high at Monday's opening bell and handed most of it back within the hour.
- The index lagged the S&P 500 and Nasdaq as chip stocks rebounded and last week's rotation ran in reverse.
- FOMC Minutes on Wednesday will show how seriously the committee is weighing a hike.
The Dow Jones Industrial Average (DJIA) finally crossed 53,000 on Monday, spiking to a record just above the handle in the opening minutes and holding it for roughly the length of the ceremony that produced it. President Trump rang the opening bell from the Oval Office in a first-of-its-kind joint event with both major exchanges. The index celebrated by tagging fresh all-time highs, and sellers removed close to 400 points inside half an hour. By early afternoon in New York the Dow sat flat near 52,900 while the S&P 500 added 0.7% and the Nasdaq rose 1.1%. The fade and the lag share one explanation: Monday was a technology session, and the Dow's march into record territory was never a technology story. Leadership on loanThe index climbed nearly 2% last week while the benchmark semiconductor fund shed more than 3% for its second straight losing week, as money rotated out of the chip trade into nearly everything else. On Monday the flow reversed, with chips bouncing roughly 3% on an expanded Broadcom supply deal with Apple, leaving the Dow holding a record it lacked the energy to extend. Strategists frame the second half as a tug-of-war between the artificial intelligence trade and the broader market. The Dow sits on the broader-market side of that argument, which makes Monday's record both real and conditional. Records with a hawkish soundtrackThe genuinely strange part of this rally is that it is happening while the market debates whether the next move from the Federal Reserve (Fed) is a hike, not a cut. Thursday's June Nonfarm Payrolls (NFP) report printed 57K against expectations above 100K, paring the hike chatter and letting stagflation worries fade into the long weekend. Monday's Institute for Supply Management (ISM) Services Purchasing Managers Index (PMI) pushed back: the headline matched consensus at 54, but the employment gauge returned to expansion at 51.2 after months of contraction, and prices paid eased to 67.7, still miles above the growth threshold. A Fed governor's afternoon remarks leaned firmly hawkish and the tape barely blinked. Rate markets still assign roughly three-in-four odds to a hold at this month's meeting, with the residual risk tilted toward tightening rather than relief. Housekeeping among the componentsMicrosoft, one of the index's heavyweights, slipped more than 1% after announcing 4.8K job cuts, about 2% of its workforce, with the Xbox unit absorbing an outsized share. Management framed the reductions as adapting to the artificial intelligence era, a polite way of saying the spending has to come from somewhere. Fellow component IBM went the other way as analysts lifted price expectations into its results later this month, a reminder that earnings will soon judge whether this record ages well. Wednesday is the only date that countsThe calendar stays second-tier until Minutes from the June Federal Open Market Committee (FOMC) meeting land at 18:00 GMT on Wednesday. The committee held at 3.75% last month with an unmistakably hawkish lean, and updated projections showed a visible bloc open to tightening again this year; the Minutes will reveal how broad that appetite runs. Around it, a private payrolls update arrives Tuesday at 12:15 GMT, weekly jobless claims follow Thursday at 12:30 GMT with consensus near 220K against 215K prior, and the New York Fed president speaks later that day. Levels to watchResistance: The 53,000 handle is the number that matters, with Monday's record just above it near 53,050. Acceptance above the handle on a daily close turns the milestone from a headline into a floor. Support: Initial demand rests around 52,750, the shelf that absorbed the morning washout, with Monday's spike low close to 52,650 beneath it and the round 52,500 area below that. Bias: Bullish. The record fade was a rotation story rather than a rejection; buyers repaired most of a 400-point flush within two hours, and the uptrend off the April base near 45,000 is not in question. A hawkish shock in Wednesday's Minutes is the one item with the weight to change that; absent it, the path of least resistance still runs through 53,000.
Dow Jones daily chart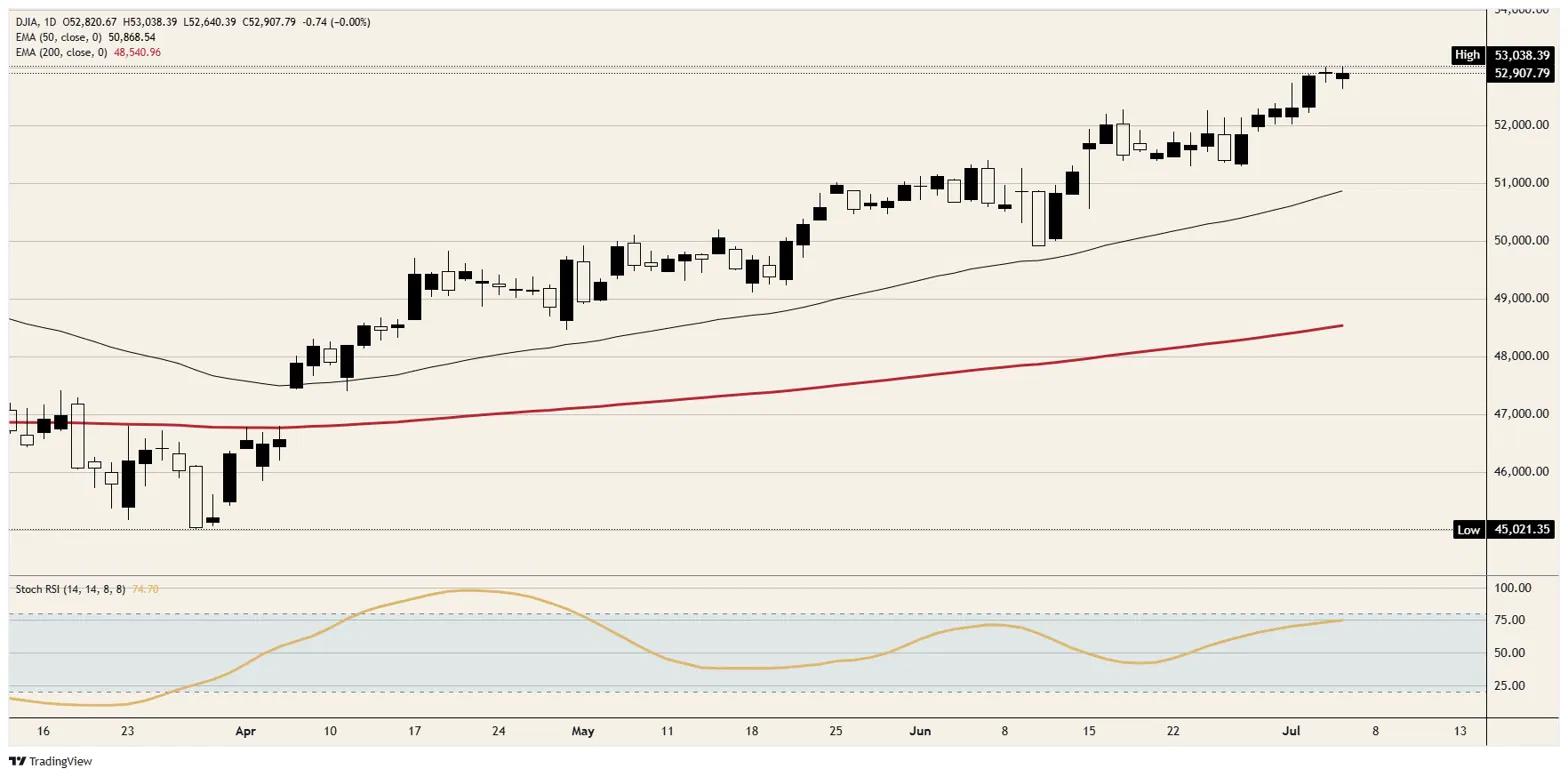
Dow Jones FAQs
The Dow Jones Industrial Average, one of the oldest stock market indices in the world, is compiled of the 30 most traded stocks in the US. The index is price-weighted rather than weighted by capitalization. It is calculated by summing the prices of the constituent stocks and dividing them by a factor, currently 0.152. The index was founded by Charles Dow, who also founded the Wall Street Journal. In later years it has been criticized for not being broadly representative enough because it only tracks 30 conglomerates, unlike broader indices such as the S&P 500.
Many different factors drive the Dow Jones Industrial Average (DJIA). The aggregate performance of the component companies revealed in quarterly company earnings reports is the main one. US and global macroeconomic data also contributes as it impacts on investor sentiment. The level of interest rates, set by the Federal Reserve (Fed), also influences the DJIA as it affects the cost of credit, on which many corporations are heavily reliant. Therefore, inflation can be a major driver as well as other metrics which impact the Fed decisions.
Dow Theory is a method for identifying the primary trend of the stock market developed by Charles Dow. A key step is to compare the direction of the Dow Jones Industrial Average (DJIA) and the Dow Jones Transportation Average (DJTA) and only follow trends where both are moving in the same direction. Volume is a confirmatory criteria. The theory uses elements of peak and trough analysis. Dow’s theory posits three trend phases: accumulation, when smart money starts buying or selling; public participation, when the wider public joins in; and distribution, when the smart money exits.
There are a number of ways to trade the DJIA. One is to use ETFs which allow investors to trade the DJIA as a single security, rather than having to buy shares in all 30 constituent companies. A leading example is the SPDR Dow Jones Industrial Average ETF (DIA). DJIA futures contracts enable traders to speculate on the future value of the index and Options provide the right, but not the obligation, to buy or sell the index at a predetermined price in the future. Mutual funds enable investors to buy a share of a diversified portfolio of DJIA stocks thus providing exposure to the overall index.
|
|
|
| | Jul 6 2026 5:51PM EST |
|
|
| | - The Swiss Franc weakens against the US Dollar as the Greenback benefits from renewed demand.
- The ISM Services PMI meets expectations in June, while price pressures ease and employment improves.
- Investors digest an unexpected rise in the Swiss Unemployment Rate ahead of the Fed Minutes on Wednesday.
USD/CHF gains 0.37% on Monday, trading around 0.8060 at the time of writing, as the US Dollar (USD) rebounds despite slightly softer expectations for further monetary tightening by the Federal Reserve (Fed). The Greenback's recovery comes as investors reassess the monetary policy outlook following last week's weaker-than-expected United States (US) Nonfarm Payrolls (NFP) report. Despite signs of a cooling labor market, the US Dollar is benefiting from renewed demand, also supported by persistent geopolitical tensions in the Middle East, particularly around the Strait of Hormuz. According to the CME FedWatch tool, markets continue to price in a scenario of additional Fed interest rate hikes by the end of the year, with a 76.9% chance. Investors are now awaiting the release of the Federal Open Market Committee (FOMC) Minutes from the June policy meeting on Wednesday for further guidance on the outlook for monetary policy. Fresh US data released on Monday showed that the ISM Services Purchasing Managers Index (PMI) eased slightly to 54 in June from 54.5 in May, matching market expectations. The survey indicated softer New Orders and lower Prices Paid, while the Employment Index improved. In Switzerland, the Unemployment Rate unexpectedly rose to 3.1% in June, compared with 3% in May and the market expectation of 3%. The slight deterioration in labor market conditions weighed on the Swiss Franc (CHF) at the start of the week, adding further support to the USD/CHF pair.
Swiss Franc Price Today
The table below shows the percentage change of Swiss Franc (CHF) against listed major currencies today. Swiss Franc was the strongest against the Japanese Yen.
|
USD |
EUR |
GBP |
JPY |
CAD |
AUD |
NZD |
CHF |
| USD |
|
0.06% |
-0.16% |
0.57% |
0.13% |
-0.07% |
0.30% |
0.32% |
| EUR |
-0.06% |
|
-0.21% |
0.50% |
0.07% |
-0.11% |
0.25% |
0.26% |
| GBP |
0.16% |
0.21% |
|
0.72% |
0.26% |
0.05% |
0.47% |
0.49% |
| JPY |
-0.57% |
-0.50% |
-0.72% |
|
-0.44% |
-0.63% |
-0.28% |
-0.19% |
| CAD |
-0.13% |
-0.07% |
-0.26% |
0.44% |
|
-0.22% |
0.18% |
0.22% |
| AUD |
0.07% |
0.11% |
-0.05% |
0.63% |
0.22% |
|
0.40% |
0.43% |
| NZD |
-0.30% |
-0.25% |
-0.47% |
0.28% |
-0.18% |
-0.40% |
|
0.02% |
| CHF |
-0.32% |
-0.26% |
-0.49% |
0.19% |
-0.22% |
-0.43% |
-0.02% |
|
The heat map shows percentage changes of major currencies against each other. The base currency is picked from the left column, while the quote currency is picked from the top row. For example, if you pick the Swiss Franc from the left column and move along the horizontal line to the US Dollar, the percentage change displayed in the box will represent CHF (base)/USD (quote).
|
|
|
| | Jul 6 2026 4:55PM EST |
|
|
| | - USD/JPY climbs toward 162.30 on Monday, supported by a broad-based US Dollar rally.
- Investors remain alert to the risk of intervention by Japanese authorities as the pair approaches 40-year highs.
- MUFG believes markets are still underpricing the Bank of Japan's monetary policy normalization outlook.
USD/JPY trades around 162.30 on Monday at the time of writing, up 0.58% on the day, extending its rebound after last week's pullback. The pair is moving back toward the nearly 40-year high of 162.84 reached on Wednesday, as broad US Dollar (USD) strength continues to dominate the foreign exchange market and keep pressure on the Japanese Yen (JPY). The US Dollar is benefiting from renewed demand despite last week's weaker-than-expected Nonfarm Payrolls (NFP) report. Investors are reassessing the Federal Reserve's (Fed) policy outlook, while geopolitical tensions in the Middle East, particularly surrounding the Strait of Hormuz, are also supporting safe-haven flows into the Greenback. At the same time, the wide interest rate differential between the United States (US) and Japan continues to fuel carry trades at the expense of the Japanese Yen. Although the Bank of Japan (BoJ) is gradually normalizing its monetary policy, its interest rates remain well below those of other major central banks, limiting support for the Japanese currency. The persistent weakness of the Japanese Yen is nevertheless keeping markets on alert. Japanese officials recently reiterated that they stand ready to intervene against excessive foreign exchange moves, although no action has been taken so far. Some market participants believe Tokyo could opt for an unannounced intervention to catch speculative traders off guard. Meanwhile, MUFG analysts argue that markets are still underpricing the Bank of Japan's tightening potential. According to the bank, accelerating inflation and rising Japanese government Bond yields could push the central bank to raise interest rates further in the coming months. MUFG now expects the policy rate to reach 1.5% by January 2027, with the next rate hike projected for September. At the same time, HSBC believes USD/JPY could remain in a higher trading range for an extended period as long as the US-Japan interest rate differential remains wide. However, the bank also expects Japan's Ministry of Finance to continue intervening selectively to prevent excessive depreciation of the JPY.
Japanese Yen Price Today
The table below shows the percentage change of Japanese Yen (JPY) against listed major currencies today. Japanese Yen was the strongest against the Swiss Franc.
|
USD |
EUR |
GBP |
JPY |
CAD |
AUD |
NZD |
CHF |
| USD |
|
0.08% |
-0.12% |
0.57% |
0.12% |
-0.06% |
0.35% |
0.34% |
| EUR |
-0.08% |
|
-0.19% |
0.50% |
0.06% |
-0.12% |
0.27% |
0.26% |
| GBP |
0.12% |
0.19% |
|
0.67% |
0.23% |
0.02% |
0.47% |
0.47% |
| JPY |
-0.57% |
-0.50% |
-0.67% |
|
-0.45% |
-0.63% |
-0.24% |
-0.17% |
| CAD |
-0.12% |
-0.06% |
-0.23% |
0.45% |
|
-0.21% |
0.22% |
0.25% |
| AUD |
0.06% |
0.12% |
-0.02% |
0.63% |
0.21% |
|
0.43% |
0.43% |
| NZD |
-0.35% |
-0.27% |
-0.47% |
0.24% |
-0.22% |
-0.43% |
|
-0.00% |
| CHF |
-0.34% |
-0.26% |
-0.47% |
0.17% |
-0.25% |
-0.43% |
0.00% |
|
The heat map shows percentage changes of major currencies against each other. The base currency is picked from the left column, while the quote currency is picked from the top row. For example, if you pick the Japanese Yen from the left column and move along the horizontal line to the US Dollar, the percentage change displayed in the box will represent JPY (base)/USD (quote).
|
|
|
| | Jul 6 2026 4:16PM EST |
|
|
| | - Fed hike bets cool after weak payrolls and revisions.
- ISM Services eases, but employment component returns to expansion.
- Burnham chancellor uncertainty keeps Cable capped near 1.3400.
The Pound Sterling steadies during the North American session, as the week begins in a risk-off mood, as evidenced by overall US Dollar strength in the FX markets, even though soft jobs data and trimmed hawkish Fed bets for the rest of the year. At the time of writing, the GBP/USD trades at 1.3357 after reaching a daily low of 1.3328. GBP/USD steadies as Dollar demand offsets softer Fed repricingLast week's US jobs report missed estimates, while figures for April and May were downwardly revised, triggering a repricing of a less hawkish Federal Reserve. Nevertheless, the Unemployment Rate is within the 4.5% level pencilled by officials towards the end of the year. Money markets had priced in a 22 basis points of tightening for the year’s end, according to Fed funds rates futures contracts. Meanwhile, for the upcoming July meeting, there’s a 77% chance the Fed will keep rates unchanged, versus a slim 23% chance of an increase, according to Prime Terminal. 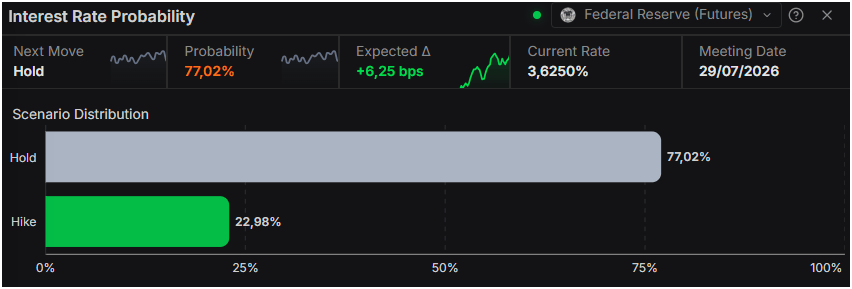 Source: Prime Terminal Source: Prime TerminalRecently, the Institute for Supply Management (ISM) revealed that the Services PMI came as expected at 54.0 but ticked lower from 54.5. Other survey measures showed that input costs eased somewhat, while the Services Employment Index improved from 47.9 to 51.2. Across the pond, the UK economic calendar was light on Monday, yet Cable is still underpinned by a slight chance of a single rate hike by the Bank of England (BoE) towards the end of the year. A month ago, money markets were pricing in at least 44 basis points of tightening, but as of writing, the swaps market is pricing in 17 basis points, implying a 70% chance of a hike. Last week, BoE Governor Andrew Bailey disregarded the chance to consider rate cuts, even though the energy shock subsided, as the US and Iran are set to begin talks by the weekend Geopolitics had taken a back seat as the second round of discussion in Islamabad would begin on July 11th. Some of the issues pending for discussion are Iran’s nuclear program, frozen assets, the Strait of Hormuz and Lebanon. In the UK, there’s uncertainty about who Andy Burnham would pick as finance minister. Newswires reported that there’s a 55% chance that Ed Miliband, a former energy minister, would be tapped as the Chancellor succeeding Rachel Reeves. Hence, the GBP/USD pair would be leaning on political uncertainty in the UK. This could pave the way for some consolidation at around current levels, at around 1.3300-1.3400, until a chancellor is picked. GBP/USD Price Forecast: Technical outlook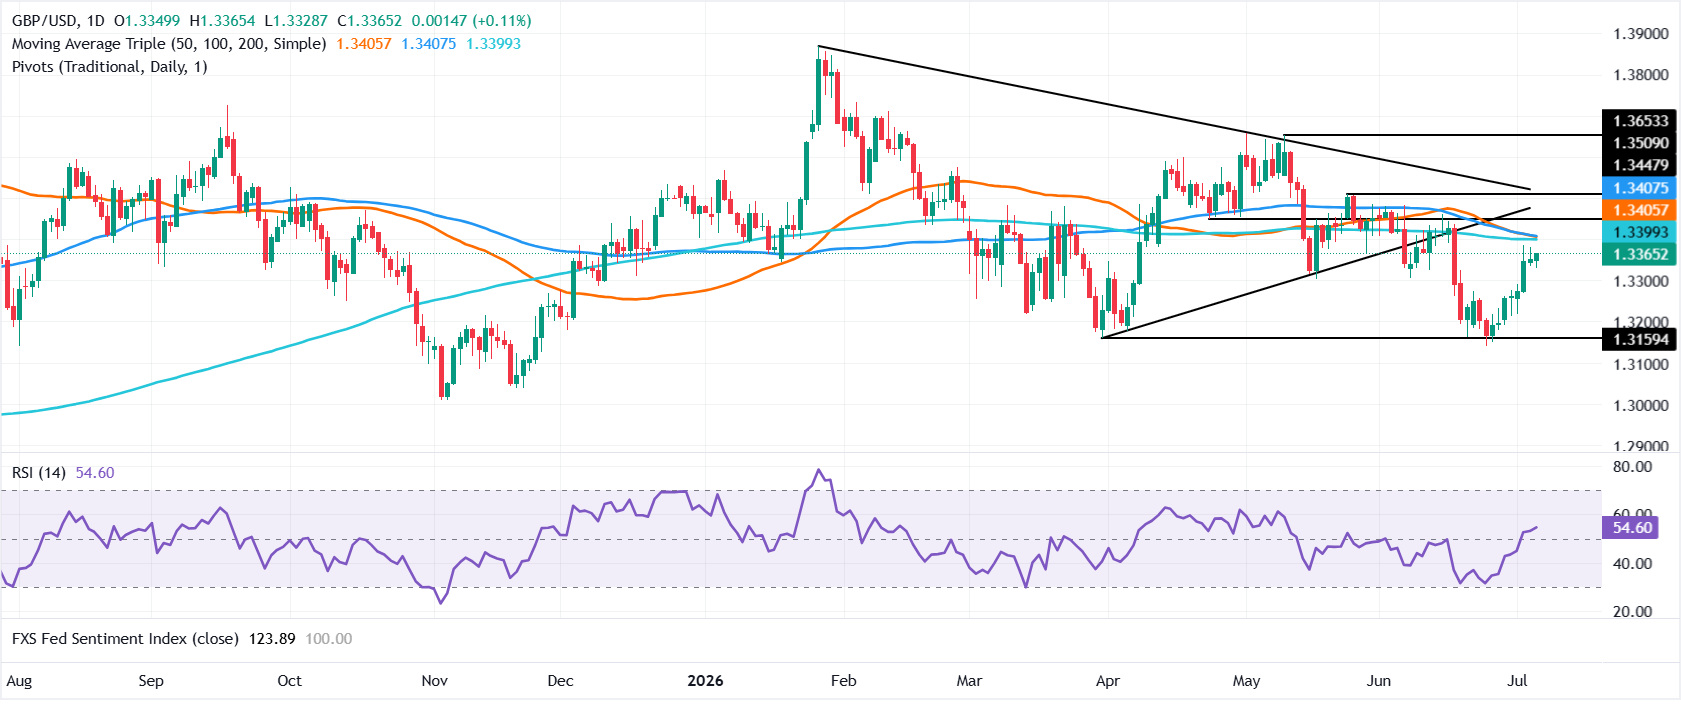 GBP/USD daily chart GBP/USD daily chartIn the daily chart, GBP/USD trades at 1.3365, maintaining a mildly bearish bias as spot holds below the simple moving average cluster now converging around 1.3406. The pair is effectively capped by this SMA resistance and the broader downward trend-line barrier near 1.3513, even as the 14-day Relative Strength Index hovers in neutral-to-slightly positive territory around 55, suggesting only modest upside momentum that has yet to reclaim the overhanging structure. On the topside, immediate resistance emerges at the simple moving average near 1.3406, with a stronger cap defined by the descending trend line around 1.3513. On the downside, the first notable structural floor aligns with the rising support trend line drawn from prior lows around 1.3159, where a break would likely expose a deeper retracement within the broader range despite the currently subdued momentum backdrop. (The technical analysis of this story was written with the help of an AI tool. Know more.)
Pound Sterling FAQs
The Pound Sterling (GBP) is the oldest currency in the world (886 AD) and the official currency of the United Kingdom. It is the fourth most traded unit for foreign exchange (FX) in the world, accounting for 12% of all transactions, averaging $630 billion a day, according to 2022 data.
Its key trading pairs are GBP/USD, also known as ‘Cable’, which accounts for 11% of FX, GBP/JPY, or the ‘Dragon’ as it is known by traders (3%), and EUR/GBP (2%). The Pound Sterling is issued by the Bank of England (BoE).
The single most important factor influencing the value of the Pound Sterling is monetary policy decided by the Bank of England. The BoE bases its decisions on whether it has achieved its primary goal of “price stability” – a steady inflation rate of around 2%. Its primary tool for achieving this is the adjustment of interest rates.
When inflation is too high, the BoE will try to rein it in by raising interest rates, making it more expensive for people and businesses to access credit. This is generally positive for GBP, as higher interest rates make the UK a more attractive place for global investors to park their money.
When inflation falls too low it is a sign economic growth is slowing. In this scenario, the BoE will consider lowering interest rates to cheapen credit so businesses will borrow more to invest in growth-generating projects.
Data releases gauge the health of the economy and can impact the value of the Pound Sterling. Indicators such as GDP, Manufacturing and Services PMIs, and employment can all influence the direction of the GBP.
A strong economy is good for Sterling. Not only does it attract more foreign investment but it may encourage the BoE to put up interest rates, which will directly strengthen GBP. Otherwise, if economic data is weak, the Pound Sterling is likely to fall.
Another significant data release for the Pound Sterling is the Trade Balance. This indicator measures the difference between what a country earns from its exports and what it spends on imports over a given period.
If a country produces highly sought-after exports, its currency will benefit purely from the extra demand created from foreign buyers seeking to purchase these goods. Therefore, a positive net Trade Balance strengthens a currency and vice versa for a negative balance.
|
|
|
| | Jul 6 2026 3:55PM EST |
|
|
| | Scotiabank strategists Shaun Osborne and Eric Theoret note GBP/USD near 1.3338 is steady versus the US Dollar (USD) and outperforming on crosses despite weak construction Purchasing Managers' Index (PMI) data. The data calendar and Bank of England (BoE) speeches are limited, while rate expectations have stabilized and the curve has un-inverted. Markets see little change at the July and September meetings, pricing modest tightening by November and December, with spot seen in a 1.3300–1.3400 range. Pound steady in tight range"The pound is steady, entering Monday’s NA session unchanged vs. the USD while outperforming most of the G10 currencies on the crosses." "Fundamental releases have been limited to third-tier construction PMI data, disappointing with a deeply contractionary print of 38.4 – a marginal rise from the prior month’s multi-year low of 38.2." "This week’s data calendar is thin and BoE speaking engagements are sparse. BoE rate expectations stabilized over the past week or so, and have also un-inverted in a manner similar to the ECB’s. Markets are pricing little change for either of the next two (July 30, Sept 17) meetings, with 12bpts of tightening for November and 17bpts by December." "Neutral – the RSI has recovered back to the neutral threshold around 50, reflecting the recovery in spot from the mid-1.31s to the upper 1.33s. We see potential near-term resistance around 1.34, a level that roughly corresponds to both the 50 and 200 day MA’s. We look to a near-term range bound between 1.3300 and 1.3400." (This article was created with the help of an Artificial Intelligence tool and reviewed by an editor. Know more.) |
|
|
| | Jul 6 2026 3:51PM EST |
|
|
| | - EUR/USD retreats as the US Dollar starts the week on a firmer footing.
- Fed and ECB are expected to keep monetary policy restrictive for now.
- ISM Services PMI points to continued resilience in the US services sector.
The Euro (EUR) trades on the back foot against the US Dollar (USD) on Monday as investors return after the extended US Independence Day weekend. At the time of writing, EUR/USD is trading around 1.1421, down 0.12% on the day. Trading conditions remain relatively subdued at the start of the week as markets reassess the monetary policy outlook for both the Federal Reserve (Fed) and the European Central Bank (ECB). Lower Oil prices after last month's interim US-Iran peace deal have eased inflation concerns, reducing pressure on central banks to tighten monetary policy aggressively. Last week's weaker-than-expected US Nonfarm Payrolls (NFP) report also lowered expectations of a near-term Fed rate hike. At the same time, softer-than-expected Eurozone inflation data reduced the likelihood of another ECB rate increase this year. ING's Chris Turner said, "A September rate hike from the European Central Bank is now priced with less than a 50% probability, but it is too early for the ECB to sound the 'all-clear' on inflation, given the risk that core inflation could still edge higher over the coming months." As inflation remains above both central banks' targets, monetary policy is likely to remain restrictive until there is clearer evidence that price pressures are moving sustainably back toward the 2% target. According to the CME FedWatch Tool, traders are currently pricing in a 56% probability of a rate hike at the September meeting. As a result, the interest rate differential continues to favor the US Dollar. The Fed's policy rate currently stands at 3.50%-3.75%, compared with the ECB's 2.25% deposit rate. The US Dollar Index (DXY), which tracks the Greenback against a basket of six major currencies, is trading around 101.04, rebounding modestly from last week's low of 100.56. On the data front, the ISM Services Purchasing Managers Index (PMI) came in at 54.0 in June, matching market expectations. While the reading eased from 54.5 in May, it marked the 23rd consecutive month of expansion.
US Dollar Price Today
The table below shows the percentage change of US Dollar (USD) against listed major currencies today. US Dollar was the strongest against the Japanese Yen.
|
USD |
EUR |
GBP |
JPY |
CAD |
AUD |
NZD |
CHF |
| USD |
|
0.11% |
-0.09% |
0.58% |
0.11% |
-0.06% |
0.37% |
0.35% |
| EUR |
-0.11% |
|
-0.19% |
0.48% |
-0.01% |
-0.15% |
0.26% |
0.24% |
| GBP |
0.09% |
0.19% |
|
0.65% |
0.16% |
-0.01% |
0.46% |
0.45% |
| JPY |
-0.58% |
-0.48% |
-0.65% |
|
-0.48% |
-0.63% |
-0.23% |
-0.17% |
| CAD |
-0.11% |
0.00% |
-0.16% |
0.48% |
|
-0.18% |
0.27% |
0.28% |
| AUD |
0.06% |
0.15% |
0.01% |
0.63% |
0.18% |
|
0.45% |
0.41% |
| NZD |
-0.37% |
-0.26% |
-0.46% |
0.23% |
-0.27% |
-0.45% |
|
-0.01% |
| CHF |
-0.35% |
-0.24% |
-0.45% |
0.17% |
-0.28% |
-0.41% |
0.01% |
|
The heat map shows percentage changes of major currencies against each other. The base currency is picked from the left column, while the quote currency is picked from the top row. For example, if you pick the US Dollar from the left column and move along the horizontal line to the Japanese Yen, the percentage change displayed in the box will represent USD (base)/JPY (quote).
|
|
|
| | Jul 6 2026 3:45PM EST |
|
|
| | European Central Bank (ECB) Executive Board member Isabel Schnabel said on Monday that the Eurozone is not back to a pre-war situation, even after the recent decline in Oil prices. Speaking at an event in Rome, Schnabel warned that the current inflation shock cannot be ignored by policymakers, as it is already creating indirect effects and could trigger second-round inflation pressures. Key takeaways:The Eurozone is not in a pre-war situation, even after the fall in oil prices.
The current shock cannot simply be looked through by the ECB.”
|
|
|
| | Jul 6 2026 3:45PM EST |
|
|
| | Federal Reserve (Fed) Governor Christopher Waller said on Monday that forward guidance can strengthen the impact of monetary policy when used properly, but warned that it can also become problematic if it limits policymakers’ flexibility. Speaking in prepared remarks for a Bank of Italy conference in Rome, Waller said forward guidance “can be a valuable tool” and has at times helped improve policymaking. Key takeaways:Forward guidance can be a valuable tool for monetary policy and may continue to be useful.
When effective, forward guidance can speed up the impact of monetary policy, as seen in late 2021.
Guidance can become a problem if it is too strong, too rigid, or limits flexibility under uncertain economic conditions.
Waller did not provide comments on the current economy or the Fed’s policy outlook.”
|
|
|
| | Jul 6 2026 3:32PM EST |
|
|
| | - AUD/USD holds near 0.6930 as softer Australian inflation limits demand for the Aussie.
- Australia’s TD-MI Inflation Gauge eased to 3.9% YoY in June from 4.4%.
- US S&P Global Services PMI slipped to 51.2, while ISM Services PMI matched expectations at 54.
AUD/USD trades with a cautious tone, sideways near the 0.6930 level on Monday after Australian inflation data showed further easing price pressures, while mixed United States (US) services figures kept the US Dollar (USD) broadly supported but without strong momentum. Australia’s TD-MI Inflation Gauge slowed to 3.9% YoY in June, down from the previous 4.4%, suggesting domestic inflation pressures are losing strength. The softer reading could reduce pressure on the Reserve Bank of Australia (RBA) to maintain a more hawkish stance, weighing on the Australian Dollar (AUD). In the United States, the S&P Global Composite Purchasing Managers Index (PMI) eased to 51.9 in June from 52.2, while the Services PMI slipped to 51.2, below expectations of 51.4 and slightly under the previous 51.3. The data pointed to slower but still positive private-sector activity, limiting aggressive USD upside. The ISM Services PMI came in at 54, matching expectations but easing from 54.5 previously. Under the surface, the Employment Index improved sharply to 51.2 from 47.9, signaling renewed hiring strength in the services sector. However, New Orders eased to 55.1 from 57.3, while Prices Paid fell to 67.7 from 71.3, suggesting that demand and cost pressures cooled. 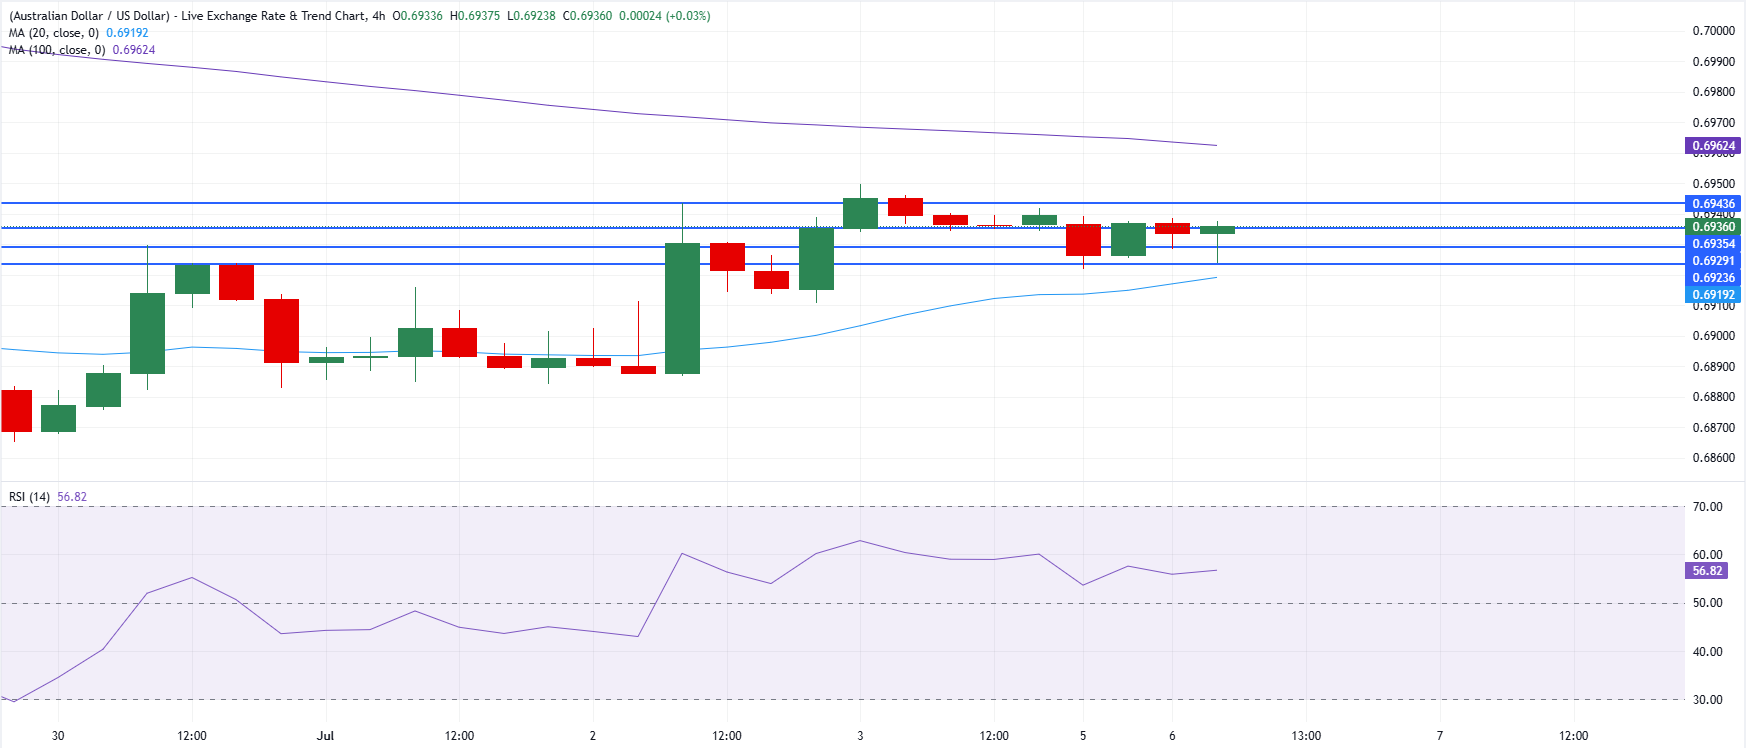
Short-term technical analysis:On the 4-hour chart, AUD/USD trades at 0.6936. The pair holds a neutral to mildly constructive tone as it trades above the 20-period Simple Moving Average (SMA) at 0.6919 but remains capped below the 100-period SMA at 0.6962. A nearby pivot at 0.6935 is being probed, while the Relative Strength Index (RSI) around 57 hints at steady but not overextended bullish momentum within this short-term consolidation. On the topside, initial resistance is seen at 0.6944, with the higher 100-period SMA at 0.6962 forming the next cap and defining a broader supply zone. On the downside, the immediate pivot support sits just below at 0.6935, followed by clustered horizontal floors at 0.6929 and 0.6924, which together underpin the pair and would need to give way to revive a deeper bearish phase. (The technical analysis of this story was written with the help of an AI tool. Know more.) |
|
|
| | Jul 6 2026 3:14PM EST |
|
|
| | United Overseas Bank’s (UOB) Quek Ser Leang indicates USD/CNH has seen a slight softening in momentum but remains confined to a narrow intraday band of 6.7800–6.7930. Over the next 1–3 weeks, the bank expects range trading between 6.7750 and 6.8080 as earlier Dollar strength has faded. On a multi-week view, a sustained recovery requires a break above the 21-week EMA at 6.8430. Offshore Yuan pair stays range bound"24-HOUR VIEW: We highlighted last Friday that “there has been a slight increase in downward momentum, but this is likely to lead to USD trading in a lower range of 6.7820/6.7940 rather than a sustained decline.” We were not wrong, although USD traded within a narrower range than expected (6.7811/6.7896). There has been no further increase in downward momentum, and we continue to expect USD to trade in a range, most likely between 6.7800 and 6.7930." "1-3 WEEKS VIEW: Last Wednesday (01 Jul, spot at 6.7920), we highlighted that the recent USD “strength has come to an end.” We also highlighted that USD “is likely to trade in a range between 6.7750 and 6.8080.” Although USD has been edging lower since then, there has been no clear increase in downward momentum. In other words, there is no change in our view" (This article was created with the help of an Artificial Intelligence tool and reviewed by an editor. Know more.) |
|
|
| | Jul 6 2026 3:03PM EST |
|
|
| | BNY’s Geoff Yu notes that crowded exposure to Latin American (LatAm) bonds is unwinding as higher U.S. yields drive a domestic repricing of real-rate risks. The bank sees flows rotating toward regional equities and maintains a constructive tactical view on Latin American carry. Peru, Mexico and United States-Mexico-Canada Agreement (USMCA)-related developments are highlighted as key policy and political drivers for regional assets. Bond outflows, equity and carry appeal"Our longstanding concern about over-crowded exposure to Latin American bonds is beginning to materialize. End-June flows marked the first time in two months that the monthly smoothed flow score turned negative." "Combined with stretched FX positioning, higher U.S. yields leave Latin America's yield-sensitive bond markets vulnerable to further adjustment." "That does not imply broad capital outflows from the region. Instead, our data point to rotation rather than retrenchment, with equity flows approaching net purchase territory after a particularly weak May." "Given the structurally lower FX hedge ratios associated with equity inflows, this rotation does not undermine our constructive tactical view on Latin American carry, where regional currencies remain our preferred expression." "Forward look: Peru’s central bank is expected to leave rates unchanged this week, although inflation remains above target and a hawkish bias is likely until the Fed signals a clearer shift in direction." (This article was created with the help of an Artificial Intelligence tool and reviewed by an editor. Know more.) |
|
|
| | Jul 6 2026 2:48PM EST |
|
|
| | - Silver snaps a four-day winning streak as a firmer US Dollar caps gains.
- Weaker-than-expected US jobs data eases expectations of a near-term Fed rate hike, supporting Silver's near-term outlook.
- The technical backdrop remains bearish as the metal remains capped below major moving averages.
Silver (XAG/USD) pauses a four-day winning streak on Monday as buyers take a breather following last week's 5.55% rally. A firmer US Dollar (USD) is also capping the precious metal's upside. At the time of writing, XAG/USD is trading around $61.75, easing from its intraday high of $63.28, the highest level since June 23. The US Dollar Index (DXY), which tracks the Greenback's value against a basket of six major currencies is trading around 100.12, up 0.22% on the day. Despite Monday's modest pullback, Silver's near-term outlook remains supported by easing expectations of a near-term Federal Reserve (Fed) interest rate hike following weaker-than-expected US Nonfarm Payrolls (NFP) data released on Thursday. However, the technical picture tells a different story, as Silver remains capped below both its short- and long-term moving averages. Technical analysis: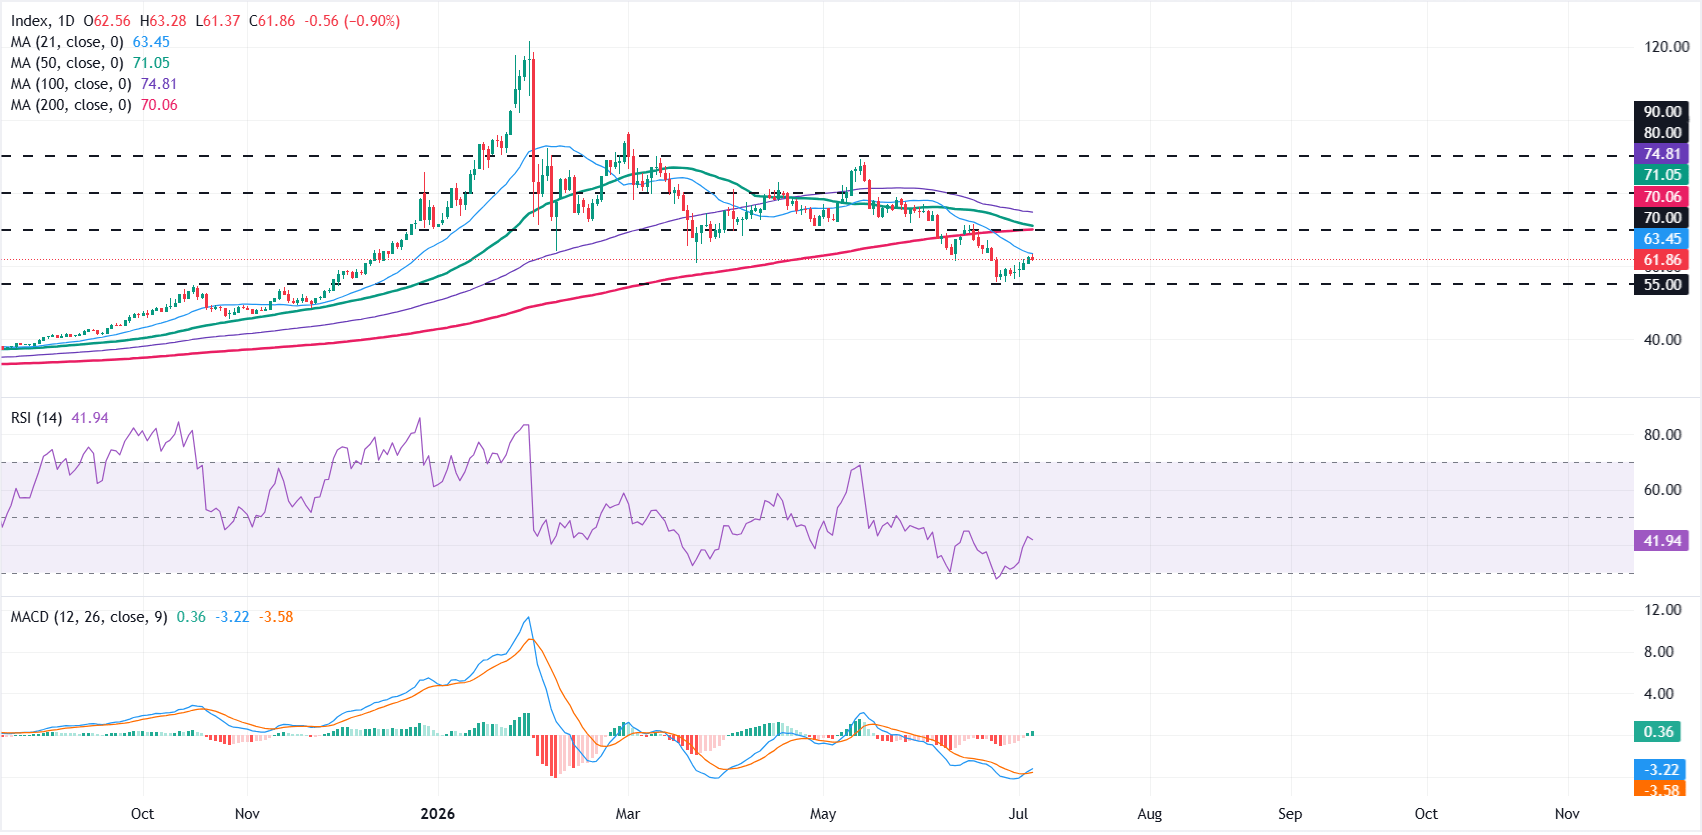 In the daily chart, XAG/USD remains in a bearish near-term bias as price holds below the 21-day Simple Moving Average (SMA) at $63.45 and the broader 200-day SMA at $70.06, underscoring a market that is still capped by medium- and long-term trend resistance. The Relative Strength Index (RSI) has recovered from oversold levels but remains around 42, while the Moving Average Convergence Divergence (MACD) has turned slightly positive, suggesting the rebound may be temporary within the broader downtrend. On the topside, initial resistance emerges at the 21-day SMA near $63.45, with a more meaningful barrier at the $70 horizontal level, reinforced by the 200-day SMA at $70.06 and the 50-day SMA at $71.05 clustering just above. Further up, the 100-day SMA around $74.81 precedes additional caps at $80 and $90. On the downside, the next notable support is the horizontal floor near $55.00, where buyers could attempt to stabilize the decline if bearish pressure resumes. 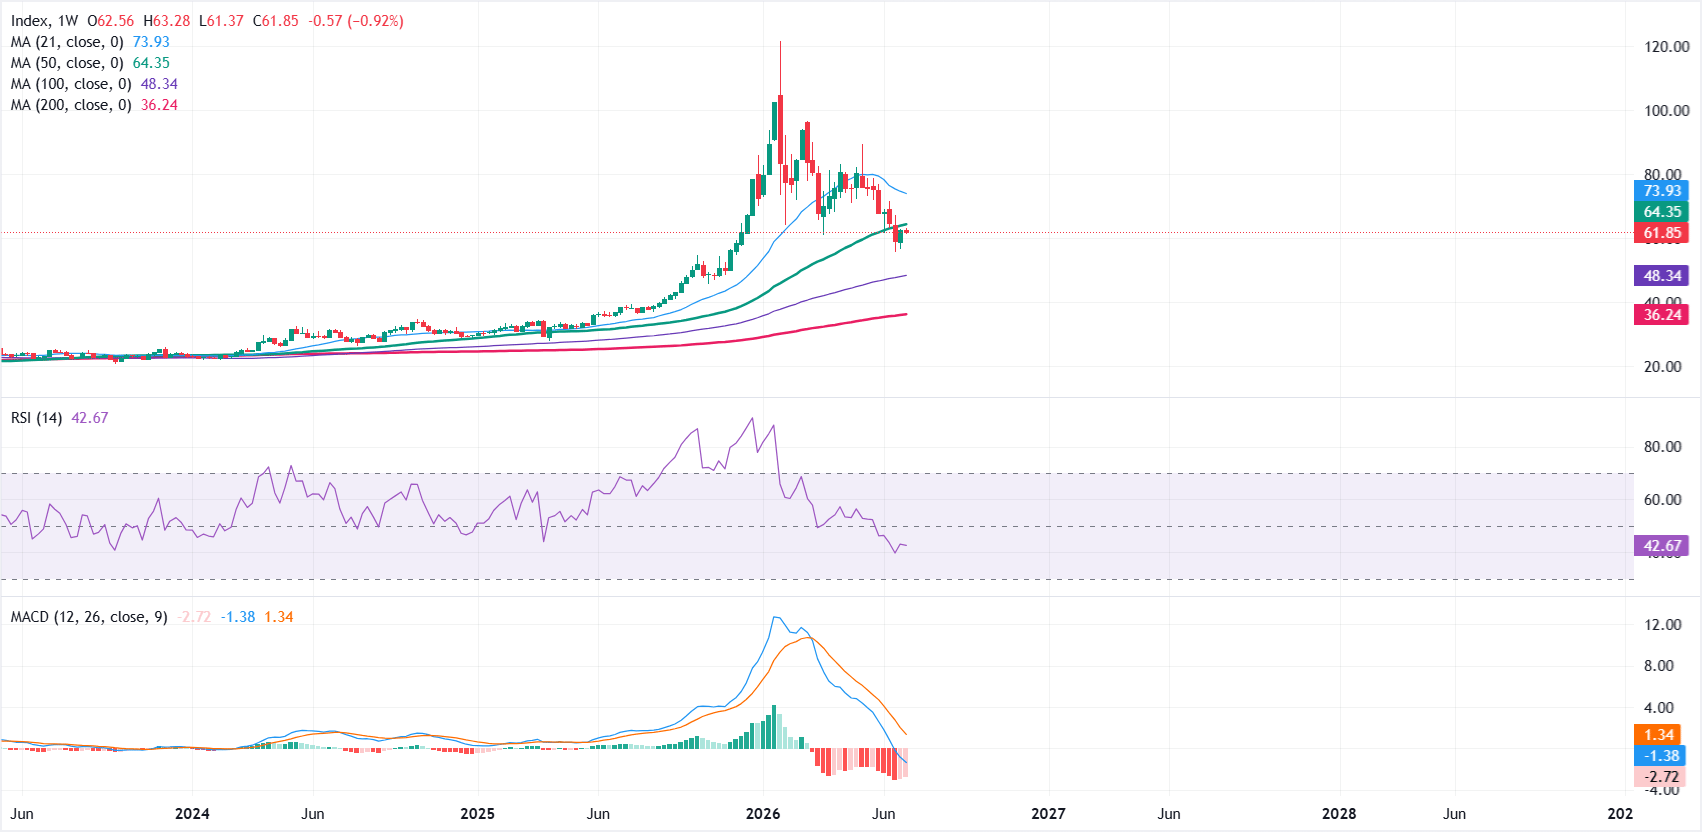 In the weekly chart, XAG/USD holds a clear bullish structural bias as price remains well above the 100-week and 200-week Simple Moving Averages (SMAs) at roughly $48.34 and $36.24, respectively, underscoring a firmly supported medium-term uptrend. Momentum, however, looks subdued: the RSI hovers near 43, while the Moving Average Convergence Divergence (MACD) remains negative, which together hint that upside traction is waning despite the broader bullish backdrop. On the topside, initial resistance emerges at the 50-week SMA near $64.35, with a stronger barrier higher up at the 21-week SMA around $73.93, levels that would need to be reclaimed to revive a more aggressive bullish phase. On the downside, immediate support is seen at the 100-week SMA at $48.34, ahead of the deeper structural floor at the 200-week SMA near $36.24, where the broader bullish trend would be expected to attract buyers on a more pronounced correction. (The technical analysis of this story was written with the help of an AI tool. Know more.)
Silver FAQs
Silver is a precious metal highly traded among investors. It has been historically used as a store of value and a medium of exchange. Although less popular than Gold, traders may turn to Silver to diversify their investment portfolio, for its intrinsic value or as a potential hedge during high-inflation periods. Investors can buy physical Silver, in coins or in bars, or trade it through vehicles such as Exchange Traded Funds, which track its price on international markets.
Silver prices can move due to a wide range of factors. Geopolitical instability or fears of a deep recession can make Silver price escalate due to its safe-haven status, although to a lesser extent than Gold's. As a yieldless asset, Silver tends to rise with lower interest rates. Its moves also depend on how the US Dollar (USD) behaves as the asset is priced in dollars (XAG/USD). A strong Dollar tends to keep the price of Silver at bay, whereas a weaker Dollar is likely to propel prices up. Other factors such as investment demand, mining supply – Silver is much more abundant than Gold – and recycling rates can also affect prices.
Silver is widely used in industry, particularly in sectors such as electronics or solar energy, as it has one of the highest electric conductivity of all metals – more than Copper and Gold. A surge in demand can increase prices, while a decline tends to lower them. Dynamics in the US, Chinese and Indian economies can also contribute to price swings: for the US and particularly China, their big industrial sectors use Silver in various processes; in India, consumers’ demand for the precious metal for jewellery also plays a key role in setting prices.
Silver prices tend to follow Gold's moves. When Gold prices rise, Silver typically follows suit, as their status as safe-haven assets is similar. The Gold/Silver ratio, which shows the number of ounces of Silver needed to equal the value of one ounce of Gold, may help to determine the relative valuation between both metals. Some investors may consider a high ratio as an indicator that Silver is undervalued, or Gold is overvalued. On the contrary, a low ratio might suggest that Gold is undervalued relative to Silver.
|
|
|
| | Jul 6 2026 2:44PM EST |
|
|
| | - The Canadian Dollar remains under pressure against the US Dollar despite support from rising Oil prices.
- Markets continue to favor the Greenback as investors expect multiple Federal Reserve rate hikes this year.
- Scotiabank says the Canadian Dollar remains weighed down by trade uncertainty, even as its undervaluation has narrowed.
USD/CAD extends its advance for a second consecutive day and trades around 1.4230 at the time of writing on Monday, up 0.20% on the day. Despite higher Oil prices, which would normally support the commodity-linked Canadian Dollar (CAD), the Loonie remains under pressure against the US Dollar (USD) as investors continue to favor the Greenback. Shipping traffic through the Strait of Hormuz is gradually returning to normal after disruptions over the weekend, while the Organization of the Petroleum Exporting Countries and its allies (OPEC+) approved a 188K-barrel-per-day production increase for next month, led by Saudi Arabia and Russia. The decision is viewed as a sign of confidence in regional stability, although it has also revived concerns about a potential global supply surplus. The US Dollar continues to strengthen as markets expect further monetary tightening from the Federal Reserve (Fed). According to the CME FedWatch tool, investors are pricing in a 76.9% chance of additional interest rate hikes by the end of the year. Market participants are now awaiting the release of the Fed's June meeting minutes on Wednesday for further guidance on the outlook for monetary policy. Meanwhile, the US ISM Services Purchasing Managers Index (PMI) eased slightly to 54 in June from 54.5 previously, matching market expectations. The survey showed weaker New Orders and softer Prices Paid, while the Employment Index improved, suggesting the US services sector continues to expand at a solid pace. According to Scotiabank, the Canadian Dollar retains a soft bias despite narrower short-term yield spreads between Canada and the United States (USD). The bank notes that confirmation of the non-renewal of the United States-Mexico-Canada Agreement (USMCA) extends trade uncertainty for Canadian exporters. Analysts also expect the Bank of Canada's (BoC) Business Outlook Survey to reflect this cautious environment. While the Canadian Dollar remains fundamentally undervalued, Scotiabank believes that this undervaluation has narrowed steadily, limiting the currency's upside potential in the near term.
Canadian Dollar Price Today
The table below shows the percentage change of Canadian Dollar (CAD) against listed major currencies today. Canadian Dollar was the strongest against the Japanese Yen.
|
USD |
EUR |
GBP |
JPY |
CAD |
AUD |
NZD |
CHF |
| USD |
|
0.17% |
-0.01% |
0.60% |
0.24% |
0.08% |
0.49% |
0.46% |
| EUR |
-0.17% |
|
-0.18% |
0.43% |
0.07% |
-0.07% |
0.33% |
0.27% |
| GBP |
0.01% |
0.18% |
|
0.61% |
0.23% |
0.06% |
0.52% |
0.48% |
| JPY |
-0.60% |
-0.43% |
-0.61% |
|
-0.38% |
-0.52% |
-0.14% |
-0.10% |
| CAD |
-0.24% |
-0.07% |
-0.23% |
0.38% |
|
-0.17% |
0.26% |
0.24% |
| AUD |
-0.08% |
0.07% |
-0.06% |
0.52% |
0.17% |
|
0.43% |
0.40% |
| NZD |
-0.49% |
-0.33% |
-0.52% |
0.14% |
-0.26% |
-0.43% |
|
-0.04% |
| CHF |
-0.46% |
-0.27% |
-0.48% |
0.10% |
-0.24% |
-0.40% |
0.04% |
|
The heat map shows percentage changes of major currencies against each other. The base currency is picked from the left column, while the quote currency is picked from the top row. For example, if you pick the Canadian Dollar from the left column and move along the horizontal line to the US Dollar, the percentage change displayed in the box will represent CAD (base)/USD (quote).
|
|
|
| | Jul 6 2026 2:42PM EST |
|
|
| | Scotiabank strategists Shaun Osborne and Eric Theoret note EUR/USD around 1.1418 trading softer against the US Dollar, though mid-pack within G10. Euro area Producer Price Index (PPI) and retail sales were in line with expectations, while German factory orders surprised higher. Short-term rates have stabilized and the curve normalized, with markets expecting no European Central Bank (ECB) move on July 23 and a 50% chance of a September hike. Euro soft as curve normalizes"The EUR is soft, down 0.2% vs. the USD and a mid-performer among the G10 in an environment of broad-based USD strength." "The short-term rates market has shown signs of stabilization over the past week or so, and the rise in implied yields on medium-term contracts has allowed the curve to normalize following an inversion that has been observed through most of the period since mid-March." "The next ECB decision is scheduled for July 23 and markets are expecting no policy change while pricing in a 50% chance of a 25bpt hike for September 10." "Bearish/neutral – the recovery in the RSI is notable, climbing from a late June sub-30 (deeply oversold) low to the low 40s with a gentle drift back toward the neutral threshold at 50. The medium-term trend remains largely neutral, with a flat range from mid-2025 roughly bound between 1.1300 and 1.2100. We see near-term support at 1.1380 and resistance above 1.1480." (This article was created with the help of an Artificial Intelligence tool and reviewed by an editor. Know more.) |
|
|
| | Jul 6 2026 2:33PM EST |
|
|
| | The Australian Dollar (AUD) is confronting a notable shift in market momentum as fresh domestic data points to cooling inflation. While the currency recently experienced a sharp surge, a consecutive monthly decline in a key consumer price gauge suggests that a broader disinflationary trend is becoming firmly established. This macro shift has thrown a wrench into hawkish market expectations for additional interest rate hikes by the Reserve Bank of Australia (RBA), prompting major financial institutions to project a period of consolidation and downside vulnerability for the AUD/USD currency cross. 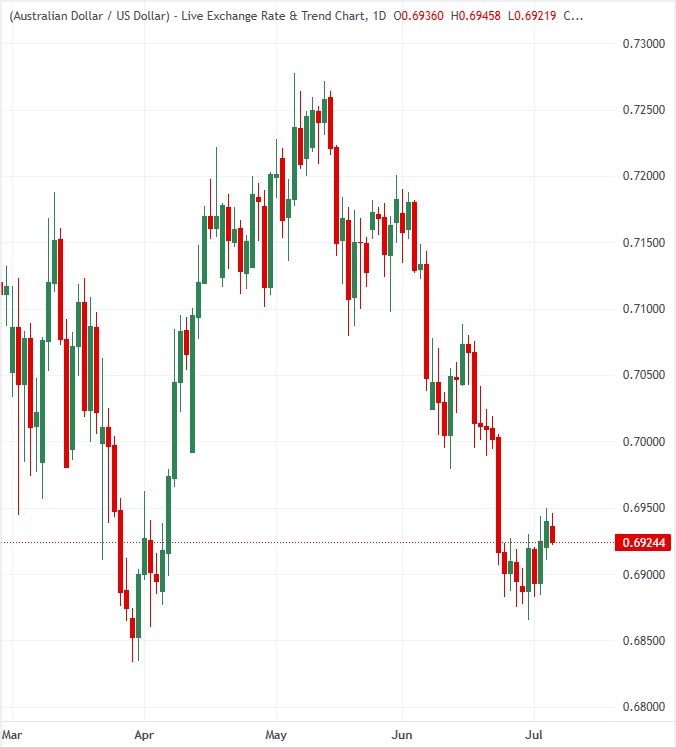 AUD/USD daily chart. Source: FXStreet. AUD/USD daily chart. Source: FXStreet.Established disinflation chips away at hawkish RBA betsMacro strategists at BNY highlight that price pressures in Australia are easing, led by a drop in global fuel costs. The Melbourne Institute inflation gauge fell for a second consecutive month in June, with both headline and underlying trimmed mean figures pulling back significantly. This suggests that the central bank may abandon its hawkish-leaning policy stance. The snapshot points to broader easing in both headline and underlying price pressure, suggesting disinflation is becoming more established. That could force the RBA to shift away from its neutral stance, with market pricing of 35bp of tightening by year-end now looking increasingly vulnerable if softer inflation momentum persists.
Technical fatigue sets in for the Australian Dollar after recent gainsThe strategy team at UOB observes that the Australian Dollar's previous bullish momentum has effectively run out of steam. Following a sharp multi-day rally, the AUD/USD pair has entered a minor holding pattern, with technical indicators flagging an early accumulation of downward bias that will likely cap near-term recovery efforts. Despite the relatively quiet price action, there has been a tentative build-up in downward momentum. Today, the bias for AUD is tilted to the downside, but given the lacklustre momentum, any decline is likely limited to a test of 0.6910.
Banks anticipate downward-biased near-term trajectory for the Australian DollarThe banks anticipate a cooling near-term trajectory for the Australian Dollar, indicating that its recent upward run has likely run its course. BNY indicates that if the softer domestic inflation momentum continues to chip away at the 35 basis points of priced-in RBA tightening, the currency's yield advantage will quickly erode. Mirroring this cautious macro view, UOB projects an initial multi-week consolidation phase where the AUD/USD pair remains bound between 0.6870 and 0.6980, but remains structurally bearish over a longer one-to-three-month horizon, warning that a technical breakdown could eventually drag the asset down to major downside targets at 0.6835 and 0.6707. (This article was created with the help of an Artificial Intelligence tool and reviewed by an editor. Know more.) |
|
|
| | Jul 6 2026 2:21PM EST |
|
|
| | TD Securities projects US output growth to move sideways in 2026, slightly below trend, with Real Gross Domestic Product (GDP) at 2.0% Q4/Q4 and unemployment around 4.3%. The Iran conflict and an oil shock pose stagflationary risks, while AI and high-income consumers support demand. Core Consumer Price Index (CPI) is seen peaking near 3.0% year-on-year in Q4 2026, with disinflation resuming in 2027. Sideways growth with stagflation risks"We expect output growth to move sideways this year, reflecting the lingering impact of the oil shock. The Iran conflict presents stagflationary risks, which we expect will keep the Fed on hold for the entire year. AI and high-income consumers have supported underlying growth." "GDP growth will likely remain slightly below trend in 2026, ending with 2.0% Q4/Q4. Stable growth should result in a still-low unemployment rate of 4.3% by Q4 2026. The labor market has signaled stabilization, and while we expect that to continue, rising input costs from the oil shock create further uncertainty that could weigh on hiring. We assign 25% odds to a US recession over the next year." "With supply chains stressed, we do not see substantial disinflation as feasible this year. We expect core CPI inflation to peak at 3.0% y/y in Q4 2026, ending the year higher than it started. The numbers are similarly high in core PCE terms. Most of the impact of higher oil prices will filter into headline inflation. We look for gradual disinflation to resume in 2027." "The outlook will be fluid amid uncertainty around developments in Iran and the Trump administration's execution of new trade, fiscal, regulatory, and immigration policies. New developments in financial markets and further escalation of geopolitical conflicts remain key risks for our economic projections over the forecast horizon." (This article was created with the help of an Artificial Intelligence tool and reviewed by an editor. Know more.) |
|
|
| | Jul 6 2026 2:19PM EST |
|
|
| | Commerzbank’s Dr. Marco Wagner notes that German manufacturing orders rose 1.9% in May, or 1.0% excluding large orders, pointing to an upward trend. He argues this supports a moderate recovery in German industry and a slight recovery in the broader German economy after a likely small Q2 decline. For 2026, Commerzbank maintains a 0.6% growth forecast. Orders signal modest industrial upturn"Business is gradually picking up again in terms of new orders. These rose by a surprisingly strong 1.9% in May; even excluding large orders, which are prone to fluctuations, the increase was 1%. Based on this upward trend in orders, we expect a recovery in German industry, even if it is likely to be moderate." "Seasonally and calendar-adjusted order intake in the manufacturing sector rose by 1.9% in May compared with April. Economists surveyed in advance had expected an increase of just over 1%. Excluding large orders, which typically fluctuate widely, the increase was 1.0%." "Overall, today’s figures offer hope for a moderate recovery in German industry, which—after a long period of stagnation—had recently been further battered by the war in Iran." "These are certainly all positive developments for German industry. However, we do not expect a strong recovery." "All in all, we expect a slight recovery for the German economy after it likely recorded a small decline in the second quarter. For 2026 as a whole, we continue to expect growth of 0.6%." (This article was created with the help of an Artificial Intelligence tool and reviewed by an editor. Know more.) |
|
|
| | Jul 6 2026 2:06PM EST |
|
|
| | - ISM Services PMI recedes to 54 in June, matching consensus.
- The US Dollar trades with decent gains on Monday.
Economic activity in the US service sector lost some momentum in June, with the ISM Services PMI easing to 54.0 from 54.5 in the previous month, matching analysts' expectations. Further poll results found that the Prices Paid Index, a crucial barometer of inflation, cooled to 67.7 from 71.3, while the Employment Index rose to 51.2 from 47.9, indicating a modest improvement in labour market conditions in the service sector. Finally, the New Orders Index weakened to 55.1 from 57.3. Market reactionThe Greenback starts the week in a positive mood, sending the US Dollar Index (DXY) back above the 101.00 hurdle.
GDP FAQs
A country’s Gross Domestic Product (GDP) measures the rate of growth of its economy over a given period of time, usually a quarter. The most reliable figures are those that compare GDP to the previous quarter e.g Q2 of 2023 vs Q1 of 2023, or to the same period in the previous year, e.g Q2 of 2023 vs Q2 of 2022.
Annualized quarterly GDP figures extrapolate the growth rate of the quarter as if it were constant for the rest of the year. These can be misleading, however, if temporary shocks impact growth in one quarter but are unlikely to last all year – such as happened in the first quarter of 2020 at the outbreak of the covid pandemic, when growth plummeted.
A higher GDP result is generally positive for a nation’s currency as it reflects a growing economy, which is more likely to produce goods and services that can be exported, as well as attracting higher foreign investment. By the same token, when GDP falls it is usually negative for the currency.
When an economy grows people tend to spend more, which leads to inflation. The country’s central bank then has to put up interest rates to combat the inflation with the side effect of attracting more capital inflows from global investors, thus helping the local currency appreciate.
When an economy grows and GDP is rising, people tend to spend more which leads to inflation. The country’s central bank then has to put up interest rates to combat the inflation. Higher interest rates are negative for Gold because they increase the opportunity-cost of holding Gold versus placing the money in a cash deposit account. Therefore, a higher GDP growth rate is usually a bearish factor for Gold price.
|
|
|
| | Jul 6 2026 2:02PM EST |
|
|
| | Jul 6 2026 2:00PM EST |
|
|
| | Jul 6 2026 2:00PM EST |
|
|
| | Jul 6 2026 2:00PM EST |
|
|
| | Jul 6 2026 2:00PM EST |
|
|
| | Scotiabank strategists Shaun Osborne and Eric Theoret describe USD/CAD around 1.4215 as consolidating, with the Canadian Dollar retaining a soft undertone despite narrower US–Canada front-end spreads. They note United States-Mexico-Canada Agreement (USMCA) non-renewal prolongs trade uncertainty, while the Bank of Canada's (BoC) Q2 Business Outlook Survey may reflect this. CAD is seen as fundamentally cheap, but its undervaluation versus equilibrium has narrowed, implying limited upside potential. CAD soft as trade risks linger"The CAD retains a soft undertone. While front-end US/Canada spreads have narrowed over the past week, the CAD has been unable to pick up any ground." "Confirmation that the US would not renew the USMCA agreement was perhaps no great surprise and while there is still room for trade talks to progress, the outcome means a prolonged period of uncertainty for Canadian and Mexican exporters." "The BoC’s Q2 Business Outlook Survey this morning is likely to reflect that uncertainty to some extent at least. The CAD continues to look fundamentally cheap but the undervaluation relative to our equilibrium estimate (1.4141 this morning) has narrowed steadily over the past month which points to limited upside potential for the CAD." "But there is also the possibility that the sustained USD rally over the past six weeks is merely pausing ahead of another push higher. The 1.4250/00 range should continue to offer some resistance to a USD advance for now. Support is 1.4150 and 1.4075/80." "Neutral—USD/CAD price action is consolidating. There are some negative signs from short-term price action and the USD remains extremely overbought on the daily RSI oscillator." (This article was created with the help of an Artificial Intelligence tool and reviewed by an editor. Know more.) |
|
|
| | Jul 6 2026 1:46PM EST |
|
|
| | Jul 6 2026 1:45PM EST |
|
|
| | Jul 6 2026 1:45PM EST |
|
|
| | - GBP/JPY rises to its highest level since January 2008 as the Japanese Yen stays under pressure.
- Wide interest-rate differences continue to support carry trades and weigh on the Yen.
- Traders remain alert for possible intervention from Japanese authorities.
GBP/JPY edges higher on Monday, climbing to levels last seen in January 2008 as the Japanese Yen (JPY) remains under pressure across the board. The Yen resumed its decline after a brief pullback last week, with USD/JPY climbing back to its highest level in four decades. At the time of writing, the cross is trading around 216.75, up 0.60% on the day. The persistent weakness in the Yen is keeping traders alert to the risk of foreign exchange intervention, with Japanese officials repeatedly stating they stand ready to act against excessive currency moves if necessary. The Yen's recent weakness increasingly appears to be driven by crowded speculative bets. However, structural headwinds remain, including plans by Japan's Prime Minister to increase government spending, which could worsen the fiscal outlook at a time when the country's debt-to-GDP ratio is already above 250%. The Bank of Japan (BoJ) ended more than a decade of ultra-loose monetary policy in March 2024 and has gradually raised interest rates since then, lifting its policy rate to 1.0% from 0.75% at its June meeting, the highest level since 1995. Even so, the pace of policy normalization remains slow, leaving Japan's interest rates well below those of other major economies. The wide interest-rate differential continues to weigh on the Yen by encouraging carry trades, in which investors borrow at Japan's relatively low borrowing costs to invest in higher-yielding currencies such as the British Pound (GBP). Meanwhile, the BOJ's hawkish stance has lifted Japanese Government Bond (JGB) yields, but the move has failed to support the Yen because higher yields also raise future debt-servicing costs. The benchmark 10-year JGB yield climbed to 2.83% on Monday, its highest level since May 1997. With the UK and Japan economic calendars relatively light this week, traders are likely to keep a close eye on any signs of foreign exchange intervention from Japanese authorities.
Japanese Yen Price Today
The table below shows the percentage change of Japanese Yen (JPY) against listed major currencies today. Japanese Yen was the strongest against the New Zealand Dollar.
|
USD |
EUR |
GBP |
JPY |
CAD |
AUD |
NZD |
CHF |
| USD |
|
0.16% |
0.01% |
0.62% |
0.15% |
0.09% |
0.48% |
0.35% |
| EUR |
-0.16% |
|
-0.13% |
0.44% |
-0.00% |
-0.04% |
0.33% |
0.19% |
| GBP |
-0.01% |
0.13% |
|
0.59% |
0.11% |
0.04% |
0.47% |
0.35% |
| JPY |
-0.62% |
-0.44% |
-0.59% |
|
-0.47% |
-0.52% |
-0.15% |
-0.20% |
| CAD |
-0.15% |
0.00% |
-0.11% |
0.47% |
|
-0.08% |
0.33% |
0.22% |
| AUD |
-0.09% |
0.04% |
-0.04% |
0.52% |
0.08% |
|
0.41% |
0.29% |
| NZD |
-0.48% |
-0.33% |
-0.47% |
0.15% |
-0.33% |
-0.41% |
|
-0.13% |
| CHF |
-0.35% |
-0.19% |
-0.35% |
0.20% |
-0.22% |
-0.29% |
0.13% |
|
The heat map shows percentage changes of major currencies against each other. The base currency is picked from the left column, while the quote currency is picked from the top row. For example, if you pick the Japanese Yen from the left column and move along the horizontal line to the US Dollar, the percentage change displayed in the box will represent JPY (base)/USD (quote).
|
|
|
| | Jul 6 2026 1:44PM EST |
|
|
| | Societe Generale analysts describe AUD/USD extending its pullback after breaking below the May trough around 0.7070 and retesting the 200-DMA near 0.6870/0.6830, aligned with March lows. They stress this zone as key support, noting November 2025’s correction also held there. With risk tone crucial, a short-term rebound is possible while 0.7070/0.7090 caps upside. Key moving averages and range levels"AUD/USD has experienced an extended pullback after breaking below the May trough around 0.7070." "The pair has recently retested the 200-DMA around 0.6870/0.6830, which also coincides with the March lows." "Notably, the correction in November 2025 found support near this MA." "If AUD/USD defends the support zone around 0.6870/0.6830, a short-term rebound cannot be ruled out." "The recent lower high near 0.7070/0.7090 may act as an important hurdle." (This article was created with the help of an Artificial Intelligence tool and reviewed by an editor. Know more.) |
|
|
| | Jul 6 2026 1:38PM EST |
|
|
| | BNY’s Geoff Yu notes that OPEC+ has ratified another production quota increase, extending gradual supply normalization and adding pressure on Brent and WTI. Yu highlights that lower Oil prices, if sustained, could ease a key macro headwind for risk assets and support expectations that major central banks’ next moves will lean toward easier policy rather than renewed tightening. OPEC+ adds to downside pressure"OPEC+ has agreed another 188,000 bpd production increase for August, extending the gradual normalization of supply and maintaining the downward pressure on crude prices." "The move continues a phased unwinding of production curbs introduced a few years ago and lifts the total quota increase since the war began to 940,000 barrels/day, or close to 1% of global demand." "The decision comes as Gulf exporters restore shipments after an interim peace pact, while Brent has fallen sharply from war highs to close to $72/barrel." "If sustained, lower energy prices will remove one of the key macro headwinds for risk assets and reinforce the view that the next move by major central banks is more likely to be toward easier policy than renewed tightening." "The alliance now faces pressure over unity, market share and the risk of a future global supply glut." (This article was created with the help of an Artificial Intelligence tool and reviewed by an editor.) |
|
|
| | Jul 6 2026 1:24PM EST |
|
|
| | MUFG’s Lee Hardman highlights that EUR/USD is trading just above 1.1400, testing the bottom of its 1.1400–1.1800 range. The Euro has faced selling on weaker data and reduced ECB hike expectations, but recent indicators show resilience. Stronger industrial output and improving confidence lead MUFG to see scope for EUR/USD to move back towards the top of the range as the ECB delivers one final hike. Euro resilience within established range"EUR/USD is trading just above the 1.1400-level at the start of this week after one failed attempt break below on sustained basis at the end of last month. The pair is currently testing the bottom of the 1.1400-1.1800 trading range that has been in place over the past year." "The resilience of the euro area economy is a supportive development for the euro and should help to limit further selling pressure. In addition, a faster-than-expected reversal of the energy price shock should improve investor sentiment towards both the euro area economy and the euro over the remainder of this year." "We expect improving cyclical momentum in the euro area to encourage EUR/USD to rebound back towards the top of the 1.1400-1.1800 trading range. We are also assuming still that the ECB will follow through and hike rates one final time in September even though upside inflation risks have eased significantly." (This article was created with the help of an Artificial Intelligence tool and reviewed by an editor.) |
|
|
| | Jul 6 2026 1:06PM EST |
|
|
| | TD Securities’ Oscar Munoz and Eli Nir expect the Federal Reserve to keep the Fed funds rate on hold throughout 2026 as US growth moves sideways and inflation stays elevated. They argue the recent jobs report reduces the risk of a July hike and see any policy move this year more likely to be a hike than a cut, with data dependence emphasized under Chair Warsh. Fed seen on extended policy hold"The jobs report likely does not alter the Fed's thinking. Underlying employment trends remain healthy, allowing the Fed to stay on hold indefinitely while focusing on the inflation mandate. The lower risk of acceleration in the labor market should also close the door to a July rate hike." "The FOMC minutes this week could provide additional insight into the policy discussion, but the risk is that it is also pared back as part of Warsh's efforts to limit forward guidance." "Waller in a panel on Monday will be the Fedspeak highlight of this week. He has not yet commented on future policy since the June FOMC, and choosing not to do so again could signal he is following Warsh's lead with limited forward guidance." "We expect the Fed to remain on hold over our forecast horizon. Inflation should remain high for the rest of the year, and the labor market has stabilized, allowing the FOMC to shift focus to its inflation mandate. If the Fed were to move this year, we believe that move is more likely to be a hike than a cut." "Under a new management that espouses a blurrier reaction function, data dependence will gain prominence for determining the path ahead for monetary policy." (The technical analysis of this story was written with the help of an AI tool. Know more.) |
|
|
| | Jul 6 2026 12:52PM EST |
|
|
| | ING’s Francesco Pesole expects the Reserve Bank of New Zealand (RBNZ) to deliver a 25bp ‘insurance’ hike in July, taking the policy rate to 2.50%, despite the sharp drop in Oil prices. He notes that May’s rate projections have been largely invalidated by lower Oil and softer inflation, and warns this move could end up being a one-off, limiting further New Zealand Dollar (NZD) support. Insurance hike seen as finely balanced"The collapse in oil prices makes the Reserve Bank of New Zealand’s 8 July decision more finely balanced. Even so, we expect policymakers to avoid disappointing hawkish pricing and deliver a 25bp ECB-style ‘insurance’ hike to anchor inflation expectations. That said, the risk of this being a one-off move is rising, which can limit NZD upside." "Back in May, the RBNZ kept rates on hold at 2.25% in a 3-3 split decision, with Governor Anna Breman casting the tiebreaking vote. The hawks’ concerns echoed those across other developed markets: the risk of inflation expectations de-anchoring and second-round effects. Breman opted for patience, but official rate projections signalled 50-75bp of tightening by end-2026." "But the oil assumptions underpinning those forecasts could not be more different now. The RBNZ assumed Dubai crude at around $95-105/bbl for the rest of 2026, versus current levels near $65. Accordingly, projections for headline CPI above 4.0% until 4Q26 now look unrealistic." "We therefore expect a 25bp hike to 2.50%, akin to the ECB’s June ‘insurance’ move. We still narrowly see one more hike in 2026, but the risk of this being a one-off has increased materially." (This article was created with the help of an Artificial Intelligence tool and reviewed by an editor.) |
|
|
| | Jul 6 2026 12:40PM EST |
|
|
| | Commerzbank’s Tatha Ghose notes that June Turkish Consumer Price Index (CPI) and Producer Price Index (PPI) data were better than expected as the energy shock faded, with headline CPI slowing to 32.1% year-on-year and PPI to 28.1%. However, seasonally adjusted monthly gains imply roughly 24% underlying inflation momentum. Ghose warns this pace remains far from a credible path to single-digit inflation or the Central Bank of the Republic of Türkiye's (CBRT) 5% target, limiting scope for policy easing. Underlying price pressures constrain CBRT options"Turkish CPI/PPI data from last Friday broadly matched the preview we outlined: headline CPI slowed to 32.1%y/y, core eased slightly, and both implied a seasonally-adjusted 1.8%m/m increase." "In other words, the “soft” 0.9%m/m raw print still translates into roughly 24% underlying inflation momentum, both for headline and core." "This is a clear improvement from the Iran-war spike months, but such a rate of fresh price increase is nowhere near a credible path towards single-digit inflation, let alone CBRT’s long-term 5% target" "The producer side gave a similar message. PPI eased to 28.1%y/y, with a 1.8%m/m rise after 2.8%m/m in May." "So the cost channel has cooled a bit, but it is not yet offering genuine disinflation support." "In conclusion, June’s data were better-than-expected as the energy shock retreated, but underlying inflation is still far too fast to offer meaningful relief for policymakers, or justify their signals about easing back the rate corridor." (This article was created with the help of an Artificial Intelligence tool and reviewed by an editor.) |
|
|
| | Jul 6 2026 12:28PM EST |
|
|
| | BNY’s Geoff Yu reports that Australia’s Melbourne Institute inflation gauge fell again in June, with both headline and trimmed mean measures easing. Yu notes that this points to more established disinflation and suggests the Reserve Bank of Australia may need to move away from its neutral stance, as current market pricing for further tightening looks vulnerable if softer inflation persists. Disinflation undermines tightening bets"Australia’s Melbourne Institute inflation gauge fell 0.4% m/m in June, led by lower fuel prices." "The drop follows a 0.3% decline in May, marking a second consecutive month of price weakness." "The y/y rate slowed to 3.9% from 4.4%, while the trimmed mean measure fell 0.5% m/m after dropping 0.1% previously, taking its y/y pace down to 2.8% from 3.6%." "The snapshot points to broader easing in both headline and underlying price pressure, suggesting disinflation is becoming more established." "That could force the RBA to shift away from its neutral stance, with market pricing of 35bp of tightening by year-end now looking increasingly vulnerable if softer inflation momentum persists." (This article was created with the help of an Artificial Intelligence tool and reviewed by an editor.) |
|
|
| | Jul 6 2026 12:15PM EST |
|
|
| | Societe Generale strategists Kit Juckes and Olivier Korber argue that Dollar strength remains underpinned by robust US growth, sticky inflation and a favourable terms of trade shock versus Europe and Asia. They note the Dollar has already risen against most majors and expect USD strength to persist through the second half of 2026, despite a recent pause. King Dollar narrative remains intact"Our 2026 FX Outlook ‘King Dollar will return’ had a cover picture of ‘Growth’ fighting ‘The Fed’ for a chest full of dollars." "The US economy was already out-performing European and Asian competition, but higher oil prices brought with them a terms of trade shock – positive for the US, negative for Europe and Asia." "As a result, the mood has changed and the dollar has risen against two thirds of the other major currencies, and all but two of the G10 ones (resource-rich AUD and NOK)." "We expect USD strength to persist through the second half of the year." "Of the main drivers of US growth (oil, AI capex and fiscal support), only the oil price is retreating." (This article was created with the help of an Artificial Intelligence tool and reviewed by an editor.) |
|
|
| | Jul 6 2026 12:02PM EST |
|
|
| | - Gold falls as the US Dollar rebounds at the start of the week.
- Weak US NFP data and easing Oil-driven inflation concerns reduce expectations of a near-term Fed rate hike.
- The technical picture remains neutral above the $4,000 support level.
Gold (XAU/USD) edges lower on Monday as a firmer US Dollar (USD) and mild profit-taking cap gains following last week's rebound from a more than seven-month low of $3,941. At the time of writing, XAU/USD trades around $4,153 after briefly climbing above the $4,200 level during the Asian trading session. Despite the intraday pullback, Gold remains supported, as weaker-than-expected US Nonfarm Payrolls (NFP) data released on Thursday have reduced expectations of an immediate Federal Reserve (Fed) interest rate hike. Meanwhile, Oil-driven inflation risks are also easing as shipping through the Strait of Hormuz continues to improve following last month's signature of a 60-day Memorandum of Understanding (MoU) between the United States and Iran. This suggests the Fed may not need to tighten policy as aggressively as markets had previously expected. However, monetary policy is expected to remain restrictive until inflation shows clearer signs of cooling. Traders are currently pricing in a 56% probability of a rate increase at the September meeting, according to the CME FedWatch Tool. The US and Iran have yet to reach a final agreement, with the future management of the Strait of Hormuz emerging as a key sticking point. Tehran views the strategic waterway as falling within its sovereignty and seeks to impose transit tolls. The next round of talks is expected to resume later this week following the funeral of Iran's Supreme Leader. With geopolitical risks still in play and expectations that the Fed will keep borrowing costs elevated, the US Dollar continues to attract buyers. The US Dollar Index (DXY), which tracks the Greenback's value against a basket of six major currencies, trades around 101.07, up 0.20% on the day. A stronger US Dollar makes Gold more expensive for holders of other currencies, while higher interest rates diminish the appeal of the non-yielding asset. Looking ahead, the US economic calendar is relatively quiet this week. The ISM Services Purchasing Managers Index (PMI) is due at 14:00 GMT, followed by the ADP Employment Change (4-week average) on Tuesday, the FOMC meeting minutes on Wednesday, and weekly Initial Jobless Claims on Thursday. These reports could offer fresh clues about the Fed's next move and influence the direction of the US Dollar and Gold. Technical analysis: XAU/USD holds above $4,000, upside remains limited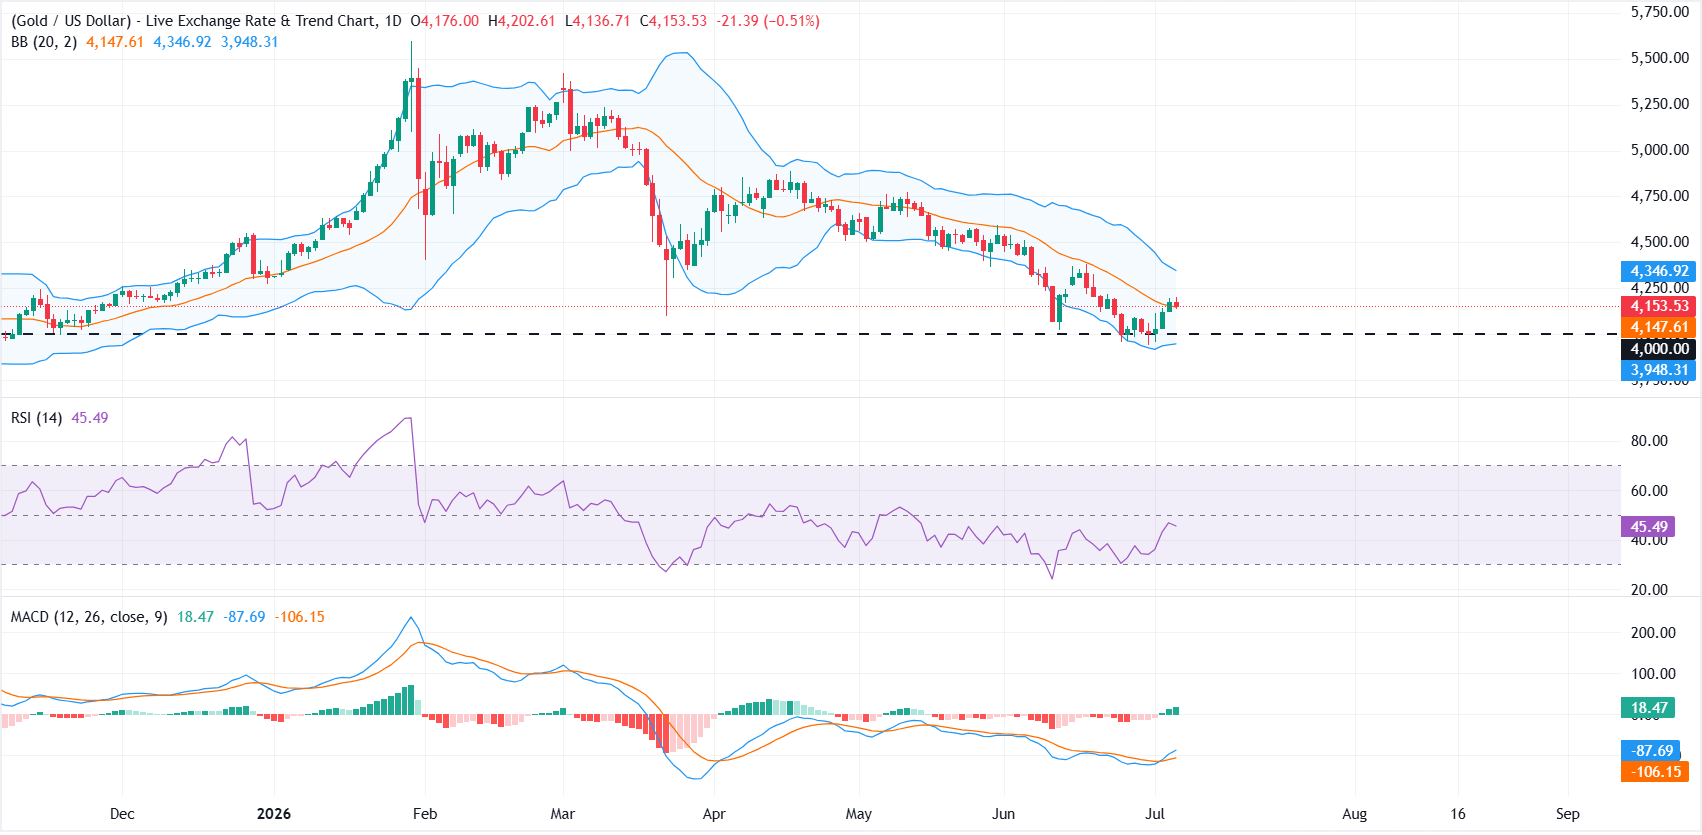 On the daily chart, XAU/USD hovers just above the 20-day Bollinger Simple Moving Average (SMA) at around $4,147, leaving the near-term tone broadly neutral. The Relative Strength Index (RSI) around 46 hints at subdued directional conviction, while the Moving Average Convergence Divergence (MACD) holds in positive territory, suggesting that upside attempts remain possible but not yet decisive. On the downside, immediate support is seen at the Bollinger SMA pivot around $4,147, followed by the horizontal support at $4,000. A break below that level could expose the lower Bollinger Band near $3,948. On the topside, a clear break of the upper Bollinger band near $4,347 would be needed to re-open the path for a stronger recovery, with a daily close above that zone likely to tilt the bias back in favor of the bulls. (This article was created with the help of an Artificial Intelligence tool and reviewed by an editor. Know more.) |
|
|
| | Jul 6 2026 11:30AM EST |
|
|
| | ING’s Chris Turner says EUR/USD is consolidating above 1.1400 as markets reassess European Central Bank (ECB) and Fed paths, with a September ECB hike priced below 50% probability. He expects ECB speakers to stress lingering inflation risks, sees Dollar strength on the Fed story, and looks for EUR/USD to stay offered in the 1.13/1.14 area with resistance at 1.1475. ECB speakers and capped EUR/USD topside"EUR/USD is consolidating above 1.1400 as the market considers the next move for central bank policy expectations and keeps one eye on geopolitics and equity market sentiment. " "A September rate hike from the European Central Bank is now priced with less than a 50% probability, but it is too early for the ECB to sound the 'all-clear' on inflation, given the risk that core inflation could still edge higher over the coming months." "Expect that message to come through from ECB speakers this week, including heavy hitters such as Isabel Schnabel and Philip Lane." "As above, we can see the dollar edging a little higher this week on the Fed story and would assume that EUR/USD resistance at 1.1475 now limits the topside." "We have a bias that EUR/USD can stay offered in the 1.13/14 area until it becomes much clearer that the Fed does need to hike rates after all. That is the house view, but it may not become clearer until the end of the quarter." (This article was created with the help of an Artificial Intelligence tool and reviewed by an editor.) |
|
|
| | Jul 6 2026 11:20AM EST |
|
|
| | - USD/JPY bounces up to 162.30, drawing closer to 40-year highs at 162.80.
- A broad-based wave of US Dollar strength is driving FX markets on Monday.
- Analysts at MUFG warn that the market might be underpricing the BoJ's commitment to normalize its monetary policy.
The Japanese Yen (JPY) has resumed its broader downtrend against the US Dollar (USD) on Monday following a mild relief last week. The USD/JPY has appreciated nearly 0.6% on the day so far, hitting session highs at around 161.30, with the 40-year high of 162.84 coming closer and risks of Tokyo intervention increasing exponentially. US Dollar strength is driving markets on Monday as investors come to terms with the likelihood that the Federal Reserve will hike interest rates this year, despite last week’s Nonfarm Payrolls disappointment. Beyond that, comments by Iranian authorities reiterating their willingness to control the Strait of Hormuz and to collect fees from vessels crossing it have raised concerns about friction with the US, which has previously said this would be unacceptable. Japanese authorities, in the meantime, are showing unusual mutism, leaving investors suspicious of a change in tactics. Market sources, including Reuters, suggest that Japanese authorities might have opted to step in without prior warnings to squeeze speculators and optimise the impact of their actions. Looking further, MUFG’s Lee Hardman suggests that the market is underpricing the hawkish Bank of Japan’s stance, at a change in fundamental scenario in favour of the battered JPY: "The ongoing steepening of the Japanese yield curve stands in contrast to flatter curves in the US, UK and Germany. The combination of the weaker yen and rising long-term JGB yields reflects some renewed fiscal concerns in Japan, and concerns that the BoJ remains behind the curve in tightening monetary policy."
Japanese Yen FAQs
The Japanese Yen (JPY) is one of the world’s most traded currencies. Its value is broadly determined by the performance of the Japanese economy, but more specifically by the Bank of Japan’s policy, the differential between Japanese and US bond yields, or risk sentiment among traders, among other factors.
One of the Bank of Japan’s mandates is currency control, so its moves are key for the Yen. The BoJ has directly intervened in currency markets sometimes, generally to lower the value of the Yen, although it refrains from doing it often due to political concerns of its main trading partners. The BoJ ultra-loose monetary policy between 2013 and 2024 caused the Yen to depreciate against its main currency peers due to an increasing policy divergence between the Bank of Japan and other main central banks. More recently, the gradually unwinding of this ultra-loose policy has given some support to the Yen.
Over the last decade, the BoJ’s stance of sticking to ultra-loose monetary policy has led to a widening policy divergence with other central banks, particularly with the US Federal Reserve. This supported a widening of the differential between the 10-year US and Japanese bonds, which favored the US Dollar against the Japanese Yen. The BoJ decision in 2024 to gradually abandon the ultra-loose policy, coupled with interest-rate cuts in other major central banks, is narrowing this differential.
The Japanese Yen is often seen as a safe-haven investment. This means that in times of market stress, investors are more likely to put their money in the Japanese currency due to its supposed reliability and stability. Turbulent times are likely to strengthen the Yen’s value against other currencies seen as more risky to invest in.
|
|
|
| | Jul 6 2026 11:09AM EST |
|
|
| | HSBC strategists argue that the USD/JPY pair is trading near its highest level in around 40 years and may have shifted into a new, higher range. They expect further US Dollar (USD) strength versus Japanese Yen (JPY) through mid-2027, assuming wide US-Japan rate differentials persist and the Ministry of Finance only intervenes selectively to curb excessive JPY weakness. USD/JPY seen in higher trading band"We changed our broad USD view after the 17 June FOMC meeting and now expect the US Dollar Index (DXY) to trade in a new and higher range. In line with this, we also anticipate further USD strength versus JPY through mid-2027." "Our view assumes the Bank of Japan (BoJ) will avoid rapid, hawkish rate hikes, keeping nominal and real US-Japan rate differentials wide. We also expect fiscal concerns to persist as authorities use fiscal policy to curb cost of living pressures, boost investment and strengthen defence." "Finally, we think the Ministry of Finance (MoF) will continue resisting unfettered JPY depreciation. A weaker JPY remains unpopular with the Japanese public and raises the risk of renewed “triple sell” episodes across JPY, equities and bonds." "We see several plausible reasons for this slightly higher bar for intervention. The short-term “fair” value of USD/JPY, based on its correlations with underlying variables including the broad USD trend, has likely shifted higher alongside the recent rise in the DXY." "Lower oil prices also reduce the urgency to curb imported inflation compared to March-May. In addition, the MoF also typically aims to surprise the market, and past episodes suggest subsequent intervention waves can occur at incrementally higher levels (e.g. 1998, 2022 and 2024)." (This article was created with the help of an Artificial Intelligence tool and reviewed by an editor.) |
|
|
| | Jul 6 2026 11:08AM EST |
|
|
| | - Oil prices edge lower as fears of a global supply glut return to the forefront.
- OPEC+ output hikes and normalizing traffic through the Strait of Hormuz weigh on market sentiment.
- Analysts see supply fundamentals keeping pressure on Crude prices.
West Texas Intermediate (WTI) US Oil trades around $68.30 at the time of writing on Monday, down 0.64% on the day, as investors continue to assess the global supply outlook following the latest production decisions by the Organization of the Petroleum Exporting Countries and its allies (OPEC+). Despite posting two consecutive daily gains last week, Crude Oil prices remain close to multi-month lows as fears of a global supply glut gradually return. Markets are digesting OPEC+'s decision to increase output by 188K barrels per day from August, with Saudi Arabia and Russia leading the production increase. The additional supply is viewed as a sign of confidence in regional stability as shipping traffic through the Strait of Hormuz has largely normalized after recent disruptions. However, lingering geopolitical risks in the Middle East continue to limit downside pressure. Although tanker traffic has broadly returned to normal, market participants remain alert to any renewed escalation that could disrupt this strategic waterway, which handles nearly one-fifth of global Oil shipments. Meanwhile, Iran has reportedly entered discussions with several Japanese companies to resume Crude Oil exports under a temporary United States (US) sanctions waiver. According to Reuters, the 60-day exemption, granted as part of ongoing negotiations between Tehran and Washington, expires on August 21, while potential buyers are said to be seeking stronger guarantees regarding shipping security before proceeding. Major banks remain broadly cautious on the Oil market outlook. Analysts at Commerzbank believe the interim agreement between the United States (US) and Iran, combined with recovering exports and additional OPEC+ production increases, reinforces the risk of a global supply surplus. Rabobank also notes that actual export capacity will continue to depend on shipping security in the Persian Gulf, while warning that geopolitical tensions could gradually fragment the global Oil market. Other institutions share a similar view. Citi expects Brent Crude to fall toward $60 by year-end, compared to $71.80 at the time of press, as market fundamentals regain control following the easing of disruptions in the Strait of Hormuz. Goldman Sachs also believes the Oil market has entered a new phase in which prices may continue to trend gradually lower despite temporary rebounds driven by geopolitical headlines.
WTI Oil FAQs
WTI Oil is a type of Crude Oil sold on international markets. The WTI stands for West Texas Intermediate, one of three major types including Brent and Dubai Crude. WTI is also referred to as “light” and “sweet” because of its relatively low gravity and sulfur content respectively. It is considered a high quality Oil that is easily refined. It is sourced in the United States and distributed via the Cushing hub, which is considered “The Pipeline Crossroads of the World”. It is a benchmark for the Oil market and WTI price is frequently quoted in the media.
Like all assets, supply and demand are the key drivers of WTI Oil price. As such, global growth can be a driver of increased demand and vice versa for weak global growth. Political instability, wars, and sanctions can disrupt supply and impact prices. The decisions of OPEC, a group of major Oil-producing countries, is another key driver of price. The value of the US Dollar influences the price of WTI Crude Oil, since Oil is predominantly traded in US Dollars, thus a weaker US Dollar can make Oil more affordable and vice versa.
The weekly Oil inventory reports published by the American Petroleum Institute (API) and the Energy Information Agency (EIA) impact the price of WTI Oil. Changes in inventories reflect fluctuating supply and demand. If the data shows a drop in inventories it can indicate increased demand, pushing up Oil price. Higher inventories can reflect increased supply, pushing down prices. API’s report is published every Tuesday and EIA’s the day after. Their results are usually similar, falling within 1% of each other 75% of the time. The EIA data is considered more reliable, since it is a government agency.
OPEC (Organization of the Petroleum Exporting Countries) is a group of 12 Oil-producing nations who collectively decide production quotas for member countries at twice-yearly meetings. Their decisions often impact WTI Oil prices. When OPEC decides to lower quotas, it can tighten supply, pushing up Oil prices. When OPEC increases production, it has the opposite effect. OPEC+ refers to an expanded group that includes ten extra non-OPEC members, the most notable of which is Russia.
|
|
|
| | Jul 6 2026 10:53AM EST |
|
|
| | - EUR/GBP drifts back from 0.8575 highs and approaches one-year lows at 0.8546.
- A string of fairly positive Eurozone releases has failed to support the Euro.
- The British Pound has been unaffected by the weak UK construction activity figures.
The Euro (EUR) remains depressed near one-year lows against the British Pound (GBP) on Monday, hitting session lows below 0.8560 after pulling back from Friday’s highs at 0.8575. A string of rather positive Eurozone figures has failed to provide any significant support, while the Pound remains moderately bid despite weak UK construction figures. Eurozone Retail Sales have picked up 0.2% in May, slightly below the 0.3% market consensus but above the 0.3% contraction seen in April. Year-over-year (Y-o-Y), consumption accelerated to 1.6%, as expected, up from April’s 1% reading. Before that, German Factory Orders figures beat expectations with a 1.9% increase in May, well above the 1.2% increase expected, partially reversing the 3.2% contraction seen in April. The Sentix Investors’ Confidence Index for July improved to -3.1, from -13.4 in June, reaching its best reading in the last four months. In the UK, May’s S&P Global Construction Purchasing Managers Index (PMI) figures revealed a weaker-than-expected improvement in the sector’s business activity. The Index improved to 38.4 from 38.2 in the previous month, yet remained well below the 40.0 reading anticipated by market consensus. The Pound remains fairly steady amid the UK’s political uncertainty as the market braces for the seventh prime minister in the last 10 years. Andy Burnham, the Mayor of Manchester and the best-positioned to replace the previous PM, Keith Starmer, has vowed to respect the fiscal rules, which is keeping Pound’s bears in check for now.
Economic Indicator
Factory Orders s.a. (MoM)
The Factory orders released by the Deutsche Bundesbank is an indicator that includes shipments, inventories, and new and unfilled orders. An increase in the factory order total may indicate an expansion in the German economy and could be an inflationary factor. It is worth noting that the German Factory barely influences, either positively or negatively, the total Eurozone GDP. A high reading is positive (or bullish) for the EUR, while a low reading is negative.
Read more.
Economic Indicator
Retail Sales (MoM)
The Retail Sales data, released by Eurostat on a monthly basis, measures the volume of retail sales in the Eurozone. It shows the performance of the retail sector in the short term, which accounts for around 5% of the total value added of the Eurozone economies. Retail Sales data is widely followed as an indicator of consumer spending. Percent changes reflect the rate of changes in such sales, with the MoM reading comparing sales volumes in the reference month with the prior month. Generally, a high reading is seen as bullish for the Euro (EUR), while a low reading is seen as bearish
Read more.
Last release:
Mon Jul 06, 2026 09:00
Frequency:
Monthly
Actual:
0.2%
Consensus:
0.3%
Previous:
-0.4%
Source:
Eurostat
|
|
|
| | Jul 6 2026 10:24AM EST |
|
|
| | Rabobank's Senior FX Strategist Jane Foley notes that EUR/USD recently fell below its prior 1-month forecast of 1.15, prompting a reassessment of projections. RaboResearch has shifted its 1- to 12-month forecast table moderately in favour of the Dollar but says its broader view is largely unchanged and expects EUR/USD to trade in choppy ranges around 1.14–1.15 in H2 and return to 1.16 over 12 months. Rangebound profile with mild USD tilt"Last month EUR/USD pushed below our previous 1 month forecast of 1.15, which forced us to re-evaluate our outlook." "While we have adjusted our 1 month to 12 month forecast table this week moderately in favour of the USD, our overall outlook is not much changed from the end of last year." "We maintain the view that EUR/USD will struggle to regain the directional uptrend that was in evidence for much of last year and that choppy ranges are more likely for the currency pair in the coming months." "That said, in contrast to current market pricing, RaboResearch expects the Fed to hold rates steady through to the end of this year." "We expect a choppy range centred around 1.14 to 1.15 in H2 this year and a return to 1.16 in 12 months as hawkish Fed views in the market abate." (This article was created with the help of an Artificial Intelligence tool and reviewed by an editor.) |
|
|
| | Jul 6 2026 10:03AM EST |
|
|
| | - Gold price fails to extend its three-day winning streak as the US Dollar rebounds.
- The Fed is highly anticipated to deliver at least one interest rate hike this year.
- Fed Chair Warsh said at the ECB forum that inflation remains too high.
Gold price (XAU/USD) is down 0.8% to near $4,140 during the European trading session on Monday. The precious metal faces selling pressure as the three-day rally hits a pause after failing to extend above $4,202. Bullions come under pressure as the US Dollar (USD) bounces back after a negative week. At press time, the US Dollar Index (DXY), which gauges the Greenback’s value against six major currencies, trades 0.22% higher to near 101.10. Technically, a higher US Dollar makes the Gold price an unfavorable risk-reward bet for investors. Last week, the US Dollar fell sharply after traders slightly trimmed the Federal Reserve’s (Fed) hawkish interest rate expectations, following the release of the United States (US) Nonfarm Payrolls (NFP) data for June. The US NFP report showed that the economy created 57K fresh jobs, significantly lower than estimates of 110K. According to the CME FedWatch tool, the odds of the Fed delivering at least one interest rate hike by the end of September are 53.2%, down from 59.4% seen a week ago. However, traders are still increasingly confident that there will be an interest rate hike by the Fed this year. Higher interest rates by the Fed diminish the appeal of non-yielding assets, such as Gold. Also, the latest remarks from Fed Chairman Kevin Warsh at the European Central Bank (ECB) Forum in Sintra show that officials are more concerned about inflation than the labor market. Warsh said at the Forum that inflation remains “too high”, and stressed to bring price stability. Gold technical analysis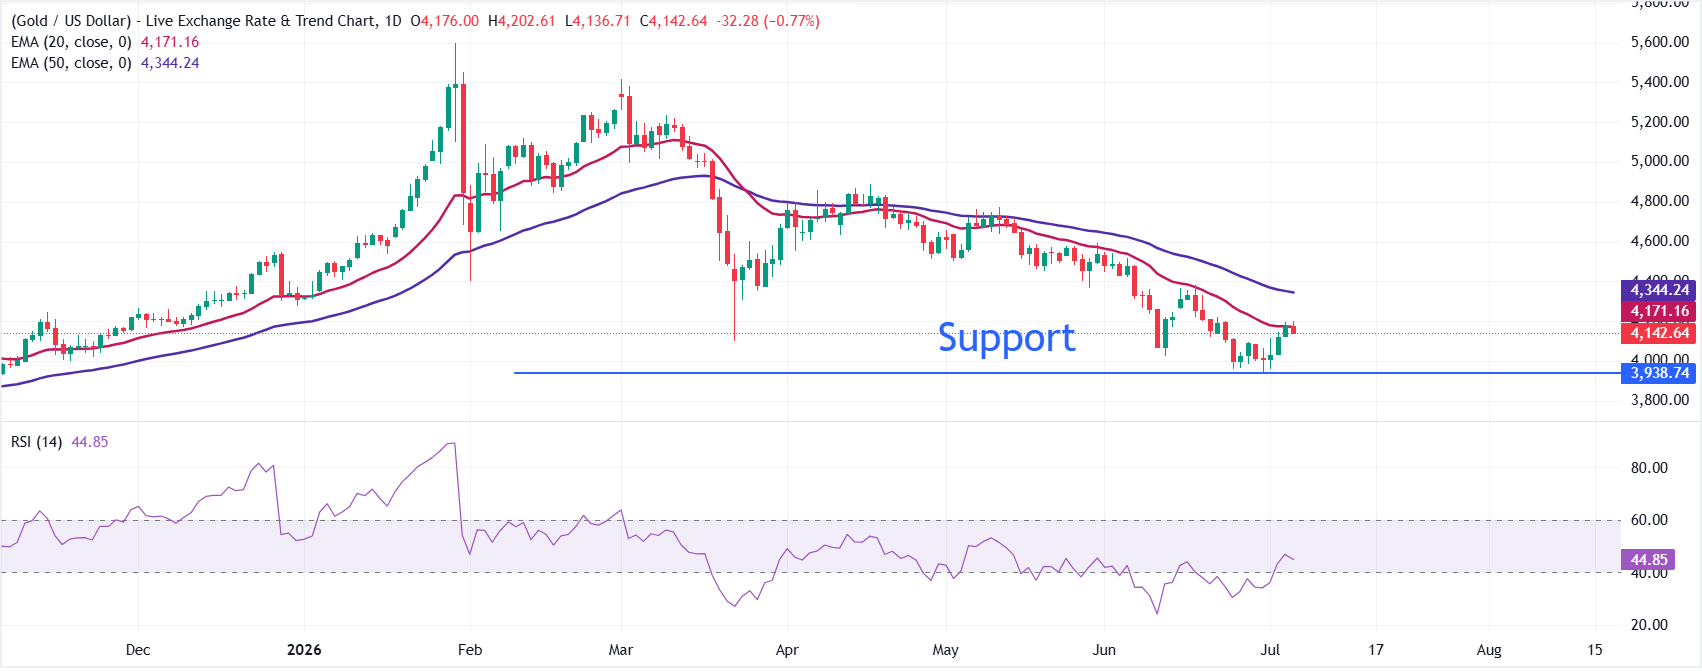 XAU/USD trades lower at around $4,143.46, maintaining a bearish near-term bias as it holds beneath both the 20-day Exponential Moving Average (EMA) at roughly $4,171 and the 50-day EMA near $4,344. The dual cluster of overhead EMAs suggests rallies are likely to be capped while price remains lodged below these trend gauges, with the Relative Strength Index (RSI) hovering just under the 50 line and hinting at subdued bullish momentum during any corrective bounces. On the topside, initial resistance emerges at the 20-day EMA around $4,171, with a stronger barrier at the 50-day EMA near $4,344, where sellers could look to reassert control if the metal extends a recovery. On the downside, the Gold price could resume its downside journey if it fails to hold the June low of $3,941.76. A break below $3,941.76 would expose the Gold price to $3,900, followed by the September 25 low near $3,722. (This article was created with the help of an Artificial Intelligence tool and reviewed by an editor. Know more.)
Gold FAQs
Gold has played a key role in human’s history as it has been widely used as a store of value and medium of exchange. Currently, apart from its shine and usage for jewelry, the precious metal is widely seen as a safe-haven asset, meaning that it is considered a good investment during turbulent times. Gold is also widely seen as a hedge against inflation and against depreciating currencies as it doesn’t rely on any specific issuer or government.
Central banks are the biggest Gold holders. In their aim to support their currencies in turbulent times, central banks tend to diversify their reserves and buy Gold to improve the perceived strength of the economy and the currency. High Gold reserves can be a source of trust for a country’s solvency. Central banks added 1,136 tonnes of Gold worth around $70 billion to their reserves in 2022, according to data from the World Gold Council. This is the highest yearly purchase since records began. Central banks from emerging economies such as China, India and Turkey are quickly increasing their Gold reserves.
Gold has an inverse correlation with the US Dollar and US Treasuries, which are both major reserve and safe-haven assets. When the Dollar depreciates, Gold tends to rise, enabling investors and central banks to diversify their assets in turbulent times. Gold is also inversely correlated with risk assets. A rally in the stock market tends to weaken Gold price, while sell-offs in riskier markets tend to favor the precious metal.
The price can move due to a wide range of factors. Geopolitical instability or fears of a deep recession can quickly make Gold price escalate due to its safe-haven status. As a yield-less asset, Gold tends to rise with lower interest rates, while higher cost of money usually weighs down on the yellow metal. Still, most moves depend on how the US Dollar (USD) behaves as the asset is priced in dollars (XAU/USD). A strong Dollar tends to keep the price of Gold controlled, whereas a weaker Dollar is likely to push Gold prices up.
|
|
|
| | Jul 6 2026 10:02AM EST |
|
|
| | Societe Generale notes that Sterling has been the strongest G10 currency since the Makerfield by-election, helped by a still-sizeable but reduced speculative short base. The bank highlights further room for gains, especially on EUR/GBP and GBP/JPY crosses, supported by M&A flows in GBP/USD and a recent upgrade of UK assets to overweight by a US bank, alongside Societe Generale’s own overweight stance on UK stocks. Sterling outperforms with room to run"In the UK, notwithstanding concerns over the Labour party tacking left under Andy Burnham, sterling is the best performer in G10 by a distance (1%) since the by-election in Makerfield on 18 June." "The short speculative base of 35.5% of OI (as of late June) has been trimmed back but in theory leaves further room for the currency to catch up, perhaps more so on cross basis (EUR/GBP, GBP/JPY?) than outright vs the dollar." "There was further M&A support for GBP/USD over the weekend after Castlelake submitted a cash bid of £5.2bn to purchase EasyJet." "We took note on Friday of the bullish note and portfolio ratings upgrade for sterling assets from market-weight to overweight by a US bank. Our own Asset Allocation team is overweight UK stocks based on superior dividend returns." "The Labour leadership contest kicks off on Thursday and nominations close on 16 July. Without a challenger, Andy Burnham would be formally appointed PM on 20 July." (This article was created with the help of an Artificial Intelligence tool and reviewed by an editor.) |
|
|
| | Jul 6 2026 9:51AM EST |
|
|
| | - USD/CHF breaks above 0.8050 and aims for a previous support area around 0.8065.
- A cautious market mood and weak Swiss employment figures are weighing on the Swissie on Monday.
- The daily chart shows a potential morning star formation in progress, a bullish sign.
The Swiss Franc (CHF) pares recent gains against the US Dollar (USD) on Monday, as fresh frictions in the Middle East are dampening investors’ appetite for risk in an otherwise calm market session. The USD/CHF pair’s rebound from two-and-a-half-week lows near 0.8000 has extended beyond 0.8050, aiming for the 0.8070 area. Comments from Iranian authorities reiterating their willingness to control the Strait of Hormuz and collect fees from vessels crossing the critical waterway cast a shadow over the fragile ceasefire, as the US rejects that option. Beyond that, fresh hostilities in Lebanon and reciprocal threats between Iran and Israel add pressure on the peace process. In Switzerland, an unexpected increase in the Unemployment Rate, which hit a nearly five-year high at 3.1% in June, from 3% in May, added weight to the Swissie. Later in the day in the US, the ISM Services PMI is expected to show a moderate slowdown, yet remain at levels consistent with healthy activity. At a later time, Federal Reserve Governor Christopher Waller is expected to meet the press. Technical Analysis: A Morning Start candlestick formation is in progress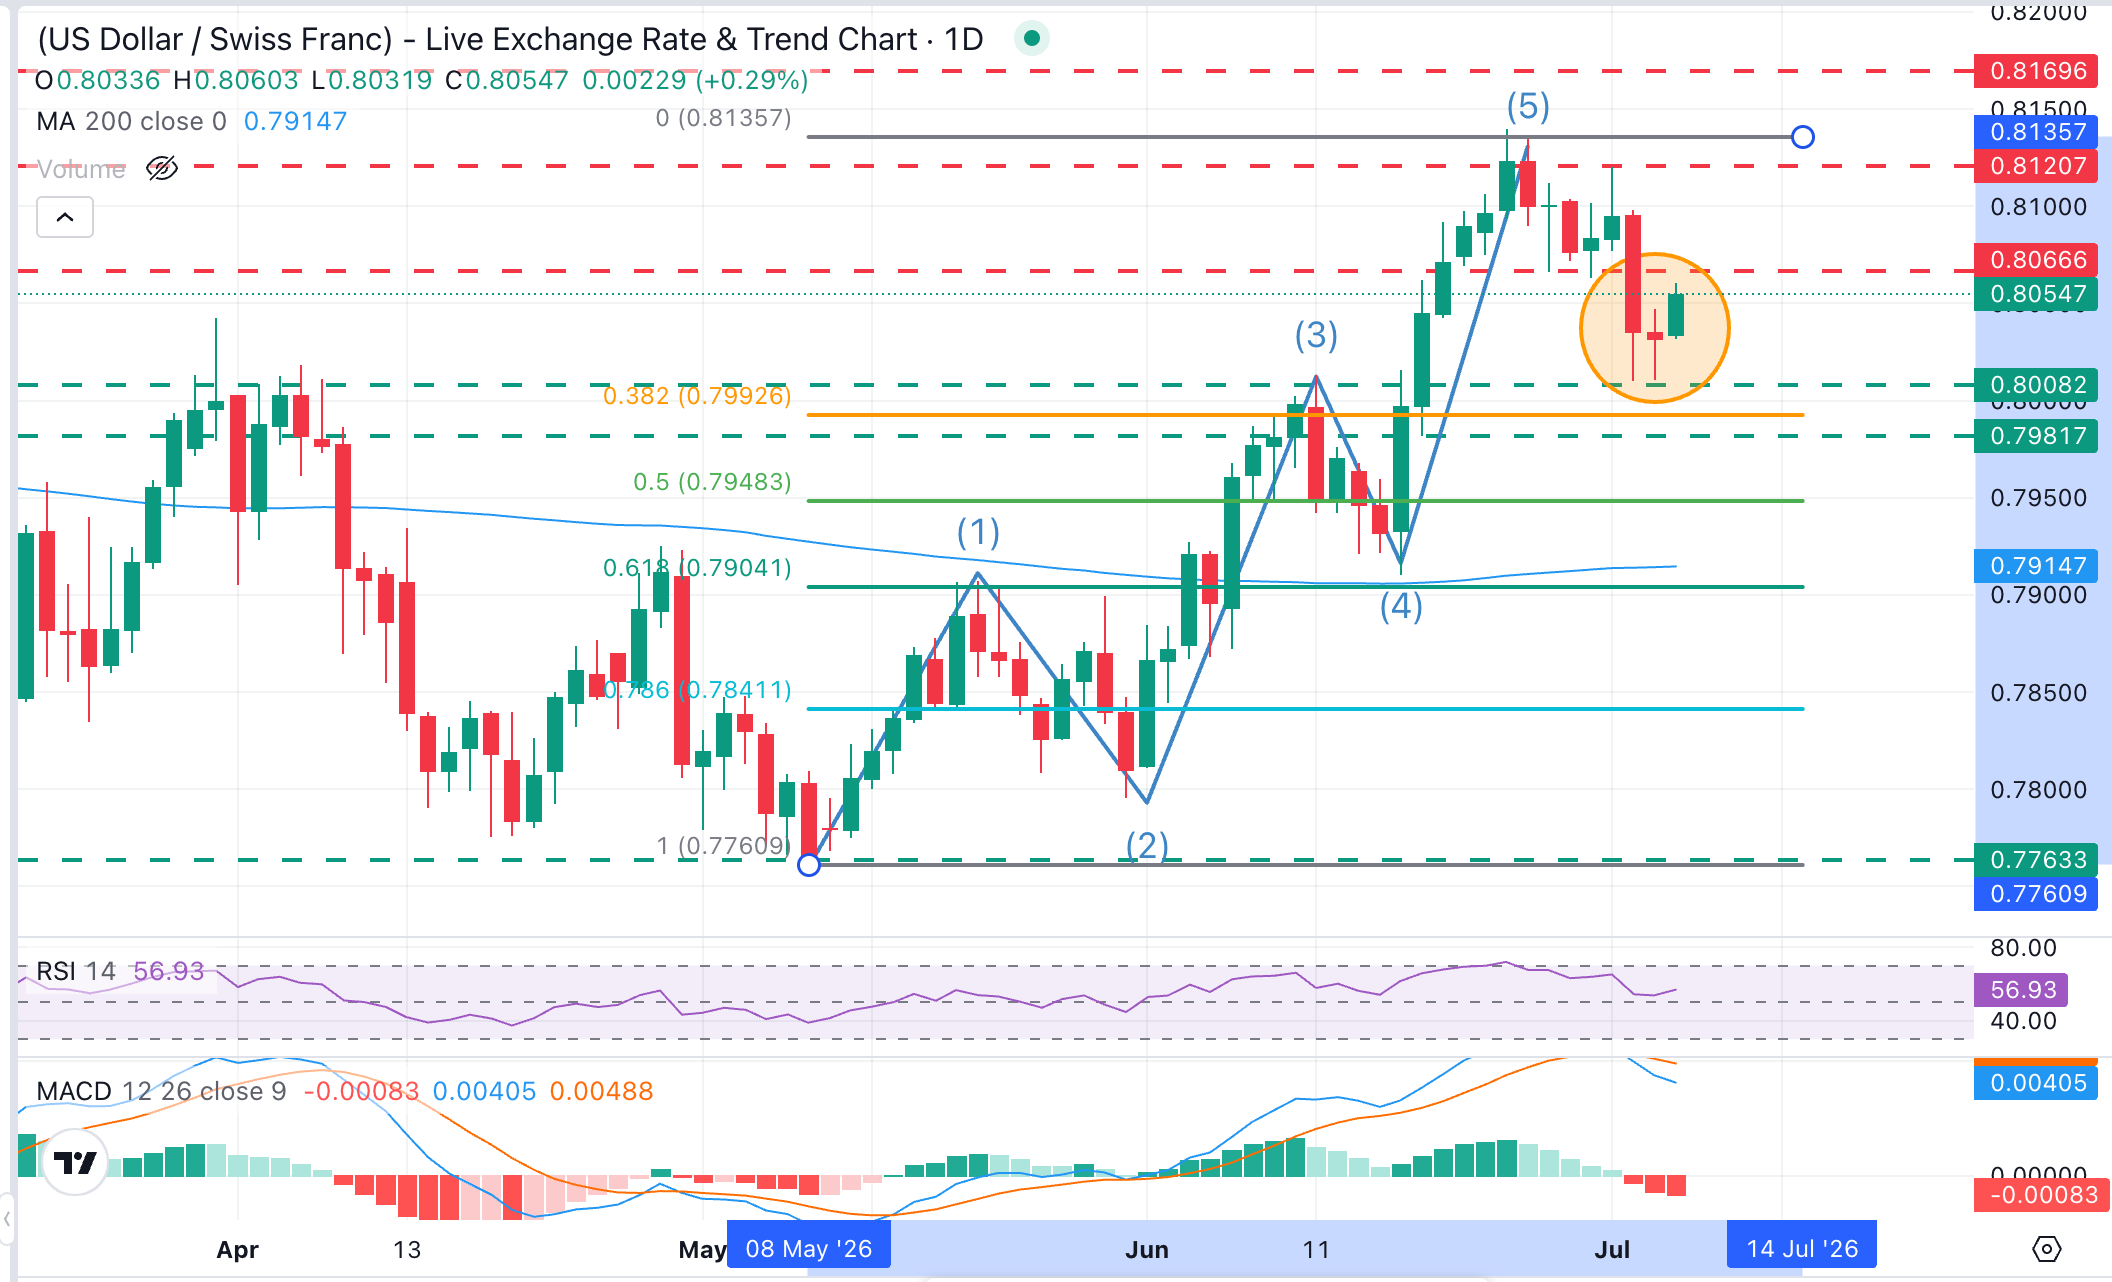
USD/CHF trades at 0.8054, with recent price action suggesting that the pair is in an A-B-C corrective reversal, following a 5-wave (Elliot Wave) bullish cycle. In that sense, a daily close above the June 26 and 30 lows in the 0.8065 area would confirm a Morning Star candle formation, a bullish sign suggesting that the bearish correction might have concluded.
Momentum indicators in the daily chart are mixed. The Relative Strength Index (14) around 57 hints at constructive but not overextended momentum, while the Moving Average Convergence Divergence (MACD) turning slightly negative suggests upside may be slowing rather than reversing.
On the topside, a confirmation above the mentioned 0.8065 shifts the focus towards the area between 0.8120 and 0.8140 (June 24, 26, and July 1 highs), ahead of the August 2025 high, at 0.8170. On the downside, the 0.8000 psychological area held bears last week. A bearish reaction below here would expose the key support area where mid-June lows meet the 200-day SMA, around 0.7915, and the 61.8% Fibonacci retracement of the May-June rally, at the 0.7900 area. (This article was created with the help of an Artificial Intelligence tool and reviewed by an editor. Know more.)
US Dollar Price Today
The table below shows the percentage change of US Dollar (USD) against listed major currencies today. US Dollar was the strongest against the Japanese Yen.
|
USD |
EUR |
GBP |
JPY |
CAD |
AUD |
NZD |
CHF |
| USD |
|
0.17% |
0.10% |
0.57% |
0.21% |
0.12% |
0.51% |
0.25% |
| EUR |
-0.17% |
|
-0.07% |
0.43% |
0.06% |
-0.02% |
0.34% |
0.09% |
| GBP |
-0.10% |
0.07% |
|
0.48% |
0.09% |
-0.01% |
0.42% |
0.18% |
| JPY |
-0.57% |
-0.43% |
-0.48% |
|
-0.37% |
-0.44% |
-0.09% |
-0.25% |
| CAD |
-0.21% |
-0.06% |
-0.09% |
0.37% |
|
-0.10% |
0.30% |
0.08% |
| AUD |
-0.12% |
0.02% |
0.01% |
0.44% |
0.10% |
|
0.41% |
0.18% |
| NZD |
-0.51% |
-0.34% |
-0.42% |
0.09% |
-0.30% |
-0.41% |
|
-0.24% |
| CHF |
-0.25% |
-0.09% |
-0.18% |
0.25% |
-0.08% |
-0.18% |
0.24% |
|
The heat map shows percentage changes of major currencies against each other. The base currency is picked from the left column, while the quote currency is picked from the top row. For example, if you pick the US Dollar from the left column and move along the horizontal line to the Japanese Yen, the percentage change displayed in the box will represent USD (base)/JPY (quote).
|
|
|
| | Jul 6 2026 9:46AM EST |
|
|
| | - The New Zealand Dollar weakens after global commodity prices declined in June.
- Diverging views fuel uncertainty ahead of the Reserve Bank of New Zealand's July policy decision.
- The US Dollar strengthens as markets continue to price in multiple Federal Reserve rate hikes this year.
NZD/USD trades around 0.5680 at the time of writing, down 0.50% on the day as the New Zealand Dollar (NZD) remains under pressure against a stronger US Dollar (USD). The Kiwi is weighed down by a 1% decline in the ANZ Commodity Price index in June, reflecting the impact of easing Middle East tensions and lower Oil prices on New Zealand's export commodities. Investors are now focused on the upcoming Reserve Bank of New Zealand (RBNZ) policy decision. The New Zealand Institute of Economic Research (NZIER) shadow board remains almost evenly split on the outcome of the July meeting, highlighting significant short-term uncertainty that could increase volatility in the New Zealand Dollar. Despite these near-term differences, NZIER economists broadly agree that the Official Cash Rate (OCR) should rise to a range of 3% to 3.25% over the next twelve months. ANZ shares a similar view and expects the RBNZ to raise the OCR by 25 basis points to 2.5% next week. The bank believes that persistent inflation risks and the weakness of the domestic currency justify further policy tightening despite the recent decline in Oil prices. BNY also maintains a hawkish outlook, expecting the RBNZ to deliver a 25-basis-point rate hike to 2.5%, supported by stronger Gross Domestic Product (GDP) growth, a resilient labor market and inflation remaining near the upper end of the central bank's target range. According to BNY, markets will primarily focus on the RBNZ's forward guidance and whether it retains a hawkish bias, keeping expectations for the OCR on track to reach around 3% by early 2027. Meanwhile, the US Dollar is gaining support as markets continue to price in multiple Federal Reserve (Fed) rate hikes by the end of the year. Investors are now awaiting Wednesday's release of the Fed's June Meeting Minutes, as well as the Institute for Supply Management (ISM) Services Purchasing Managers Index (PMI), due later in the day, for fresh clues on the future path of US monetary policy. Comments from Iran's ambassador to China regarding potential new transit fees through the Strait of Hormuz are also contributing to a cautious market mood.
New Zealand Dollar Price Today
The table below shows the percentage change of New Zealand Dollar (NZD) against listed major currencies today. New Zealand Dollar was the strongest against the Japanese Yen.
|
USD |
EUR |
GBP |
JPY |
CAD |
AUD |
NZD |
CHF |
| USD |
|
0.15% |
0.08% |
0.55% |
0.20% |
0.11% |
0.48% |
0.23% |
| EUR |
-0.15% |
|
-0.06% |
0.41% |
0.06% |
-0.01% |
0.34% |
0.09% |
| GBP |
-0.08% |
0.06% |
|
0.48% |
0.09% |
-0.01% |
0.41% |
0.16% |
| JPY |
-0.55% |
-0.41% |
-0.48% |
|
-0.36% |
-0.44% |
-0.09% |
-0.26% |
| CAD |
-0.20% |
-0.06% |
-0.09% |
0.36% |
|
-0.10% |
0.29% |
0.06% |
| AUD |
-0.11% |
0.01% |
0.00% |
0.44% |
0.10% |
|
0.40% |
0.15% |
| NZD |
-0.48% |
-0.34% |
-0.41% |
0.09% |
-0.29% |
-0.40% |
|
-0.25% |
| CHF |
-0.23% |
-0.09% |
-0.16% |
0.26% |
-0.06% |
-0.15% |
0.25% |
|
The heat map shows percentage changes of major currencies against each other. The base currency is picked from the left column, while the quote currency is picked from the top row. For example, if you pick the New Zealand Dollar from the left column and move along the horizontal line to the US Dollar, the percentage change displayed in the box will represent NZD (base)/USD (quote).
|
|
|
| | Jul 6 2026 9:41AM EST |
|
|
| | MUFG’s Lee Hardman notes that the Japanese Yen (JPY) has weakened again, pushing USD/JPY back above 162.00 and coinciding with further selling at the long end of the JGB curve. Hardman argues that the Bank of Japan (BoJ) is behind the curve, with inflation expected to accelerate and fiscal concerns mounting. MUFG now projects the policy rate at 1.50% by January 2027, with the next hike in September. BoJ tightening expectations and fiscal risks"The yen has re-weakened at the start of this week resulting in USD/JPY rising back above 162.00 after hitting a low of 160.49 on Friday. There had been speculation at the end of last week that Japan could intervene again to support the yen during the US holiday when trading conditions were less liquid, but no action has been taken contributing to the yen giving back some its recent gains." "The ongoing steepening of the Japanese yield curve stands in contrast to flatter curves in the US, UK and Germany. The combination of the weaker yen and rising long-term JGB yields reflects some renewed fiscal concerns in Japan, and concerns that the BoJ remains behind the curve in tightening monetary policy." "Inflation in Japan is expected to accelerate through the 2H of this year and into next year. It will keep pressure on the BoJ to normalize monetary policy further." "We currently believe that the Japanese rate market is underpriced for further BoJ tightening. The BoJ’s recent communication has more clearly flagged upside risks to inflation including the faster pace of rising costs passing through to higher prices." "We now expect the policy rate to reach 1.50% by January 2027 with the next hike in September. There are currently only around 6bps of hikes priced in by September leaving room for short-term yields to keep moving higher." (This article was created with the help of an Artificial Intelligence tool and reviewed by an editor.) |
|
|
| | Jul 6 2026 9:41AM EST |
|
|
|